



IOB - Technical view
IOB
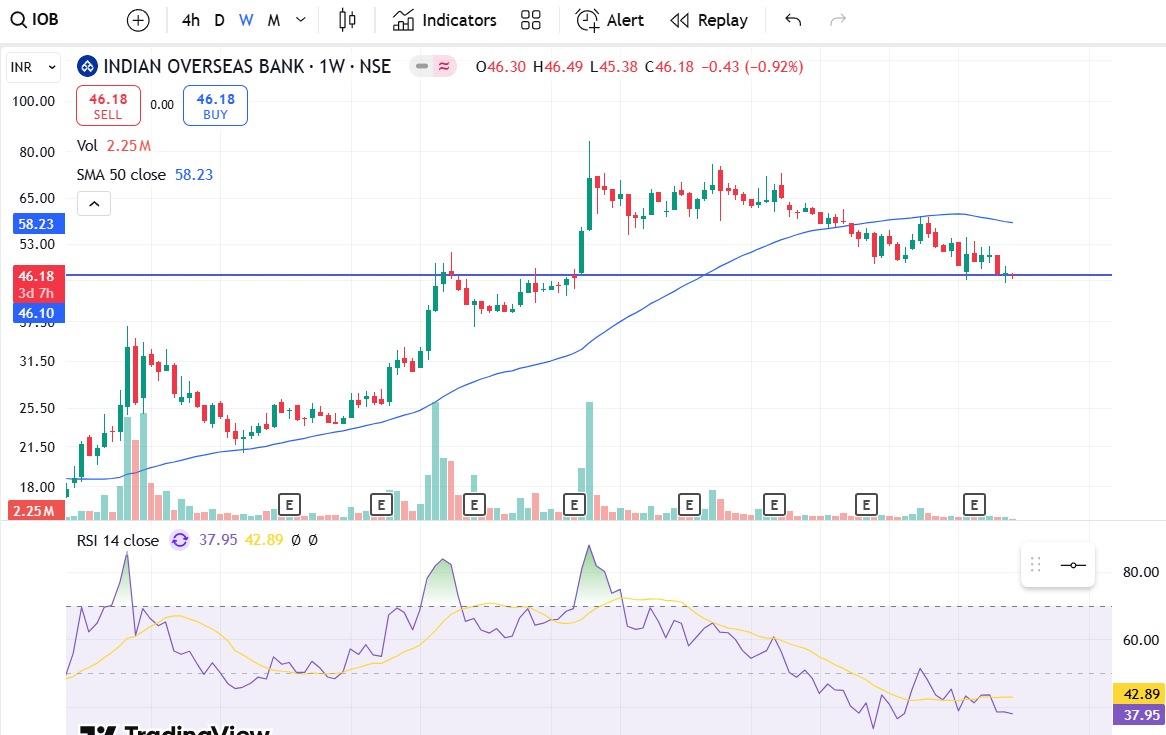
1) Chart attached in media
2) This is weekly chart
3) RSI below 40
4) Trend is bearish
5) Trendline is drawn on charts
6) 42-44 is strong support zone for the stock
7) This is government of India enterprise
8) This is not a buy/sell call
9) This is for information and learning.
Thank you,
Technofunda24
#WatchOutFor#TechnicalViews
111 likes·51 comments