



Karur Vysya Bank - Technical view
KARURVYSYA
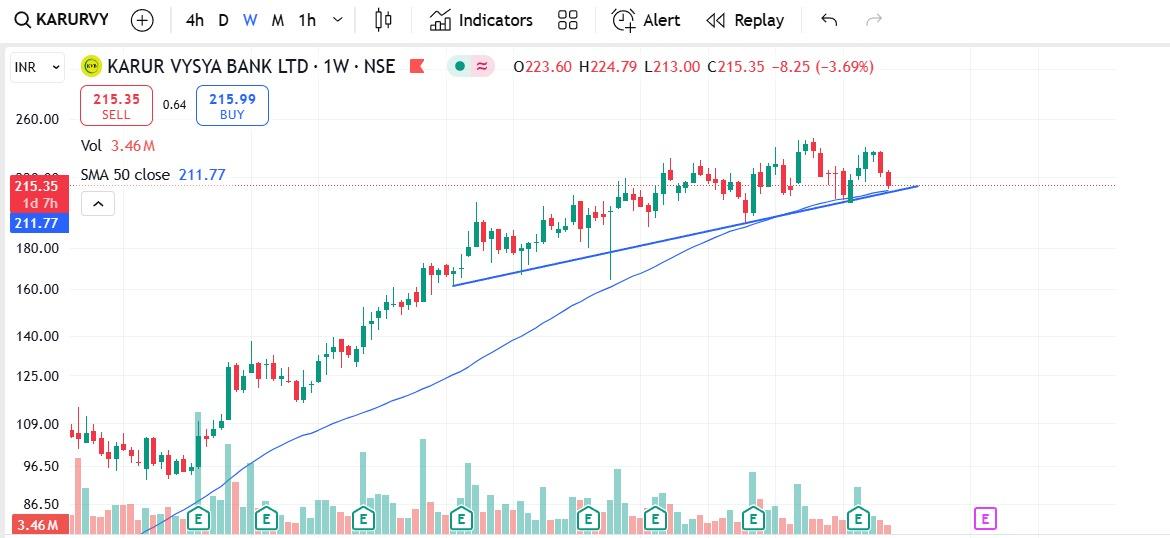
1) Chart attached in media
2) This is weekly chart
3) Trendline drawn on charts
4) Taking support from the trendline
5) Technical bias for the week is sideways
6) Also taking support at 50 SMA on weekly charts
7) 205-210 is strong support zone on downside
8) This is for information and learning.
9) This is not a buy/sell call.
Thank you,
Technofunda24
#WatchOutFor#TechnicalViews
276 likes·38 comments