



Motilal Oswal - Technical view
Motilal Oswal - Technical view
MOTILALOFS
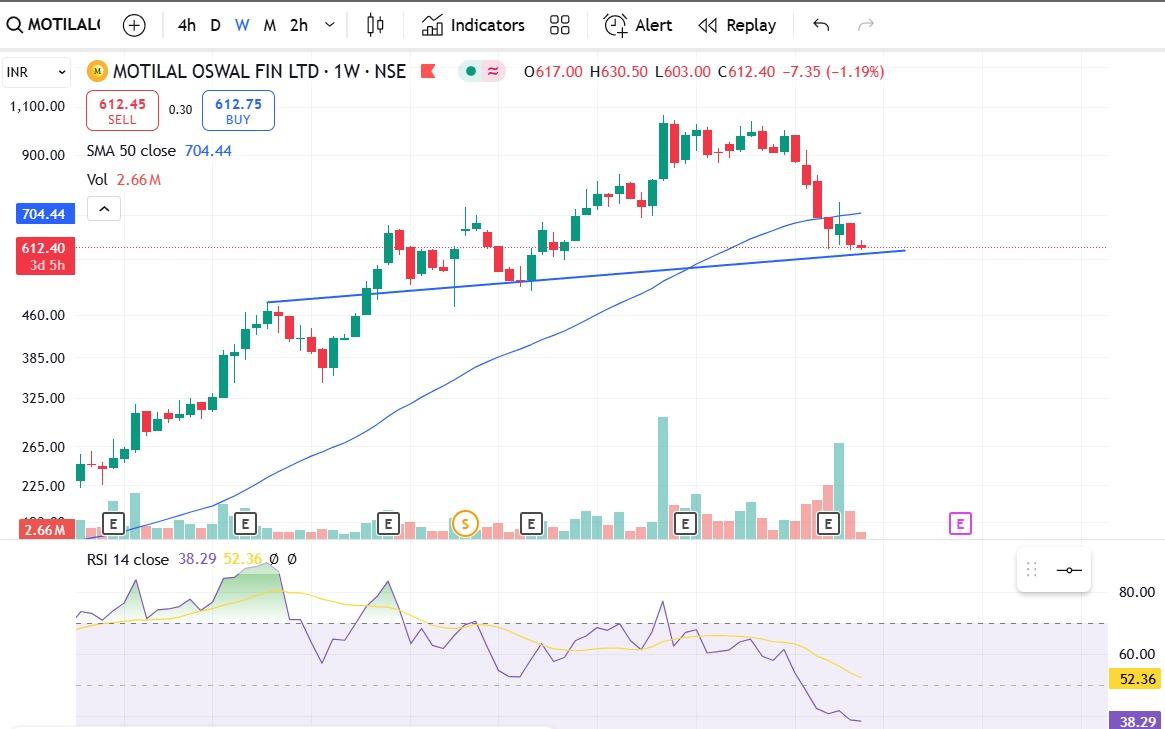
1) Chart attached in media
2) This is weekly chart
3) RSI is below 40 - hence trend is bearish
4) Trendline drawn on charts
5) As of now stock respecting the trendline
6) 600 is major support
7) Once we close below 600 major correction can be seen
8) This is for information and learning
9) This is not a buy or sell call
10) Market trend is bearish now.
Thank you,
Technofunda24
#TechnicalViews#StockInNews
186 likes·70 comments