



Nifty IT - Analysis of Charts
Nifty IT - Analysis of Charts
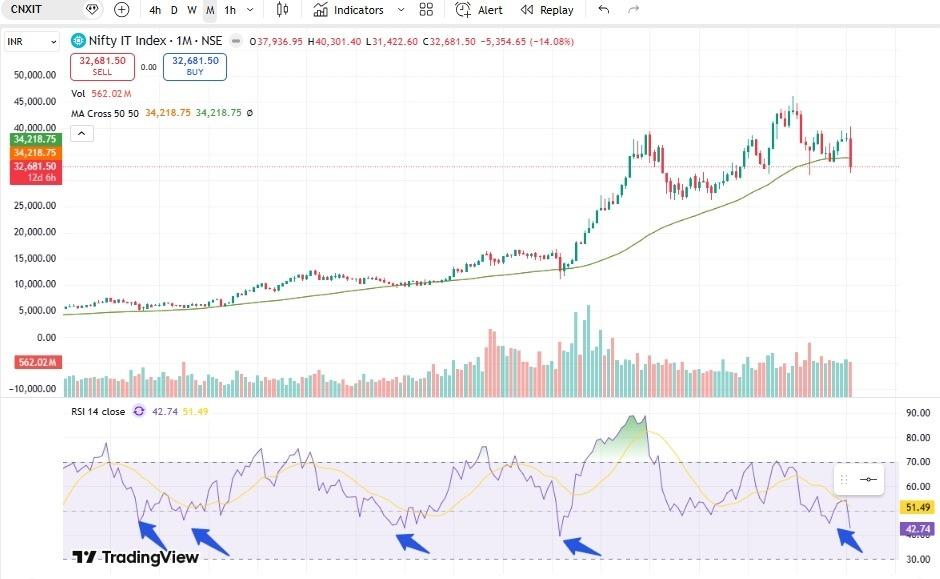
Let's analyses Nifty IT Historic chart. - Chart attached in media
This is monthly chart
Here important is RSI
Market arrow at RSI
After June 2009 Nifty IT has not broken RSI 40 on Monthly chart
This means Nifty IT has not gone into bearish momentum on monthly charts since June 2009 which is almost 16-17 years.
Stock on radar - HCLTECH
Conclusion: Conclusion is that we are just 3-4 weeks away from Bottom formation on charts considering the historic data of monthly charts.
All this is for information.
This is not a buy/sell recommendation.
Thank you,
Technofunda24
#TechnicalViews#WatchOutFor
436 likes·53 comments