Nifty realty - Technical learning
Nifty realty - Technical learning
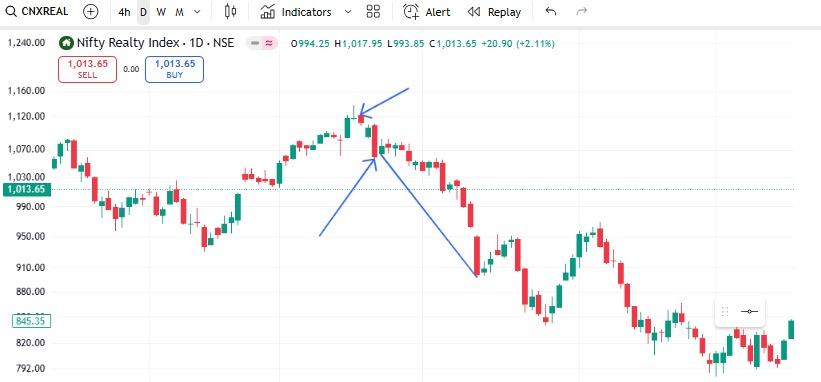
1) This is daily chart
2) This is old data
3) This is for learning only
4) We see inverse hammer on charts
5) Generally inverse hammer is a indicator of a trend change
6) This needs follow up candle - This shall be red candle
7) Here we see both - Inverse hammer and follow up red candle
8) This is indicates a change of trend from bullish to bearish.
9) Stock on radar - DLF
10) All this data is for information
11) This is not a buy/sell call.
Thank you,
Technofunda24
#StockInNews#TechnicalViews