



Nifty - Study of Bad Phase
Nifty - Study of Bad Phase
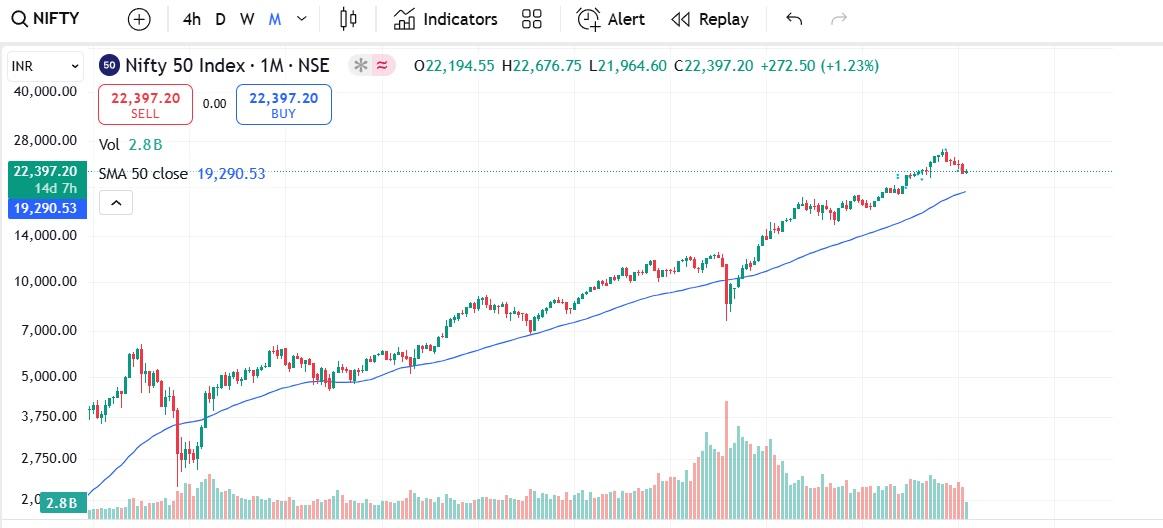
1) Chart for Nifty attached
2) This is monthly chart
3) Blue line indicates SMA 50
4) Historically in bad time Nifty takes support around 50 SMA on Monthly charts. (Blue line) In Corona time this SMA 50 was broken, and market went below this as well. this was also broken during Lehman Brothers time in 2008.
5) So, this simply implies that only 2-time SMA 50 was broken and market sustained below that.
6) In rest all cases market bounced back from SMA 50 on monthly charts.
7) This is all for information and learning. Stock on radar - APLAPOLLO
Thank you,
Technofunda24
#Today’sTradingSetup#TechnicalViews
127 likes·27 comments