



Nifty view for the week
Nifty view for the week
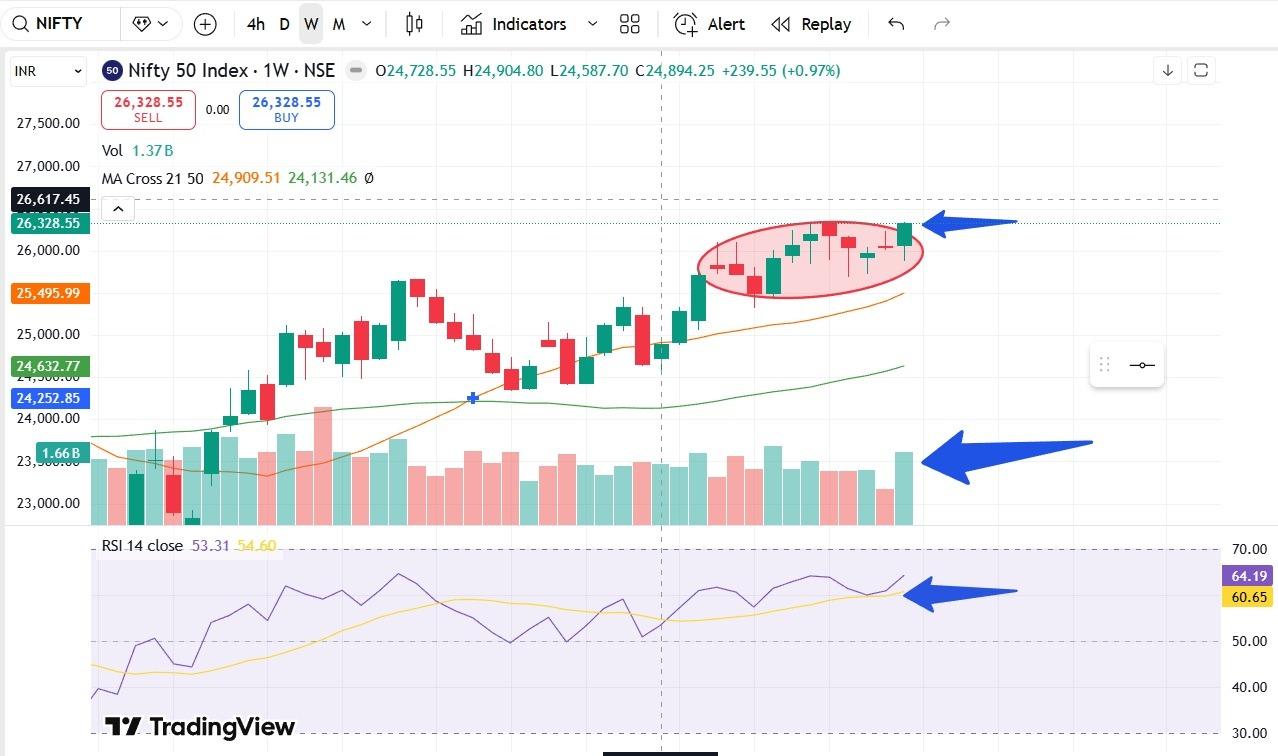
Nifty chart updated after the close.
Weekly chart
Price action positive
Volume action positive
Breakout seen from the pattern.
RSI crossover above 60.
Plus, we have daily and monthly close above 60 as well.
this is very bullish sign when we have all RSI above 60 (Daily, weekly and monthly)
Sector on radar AUTO
Stock on radar HEROMOTOCO
All this is for information.
This is not a buy/sell recommendation.
Thank you,
Technofunda24
#TechnicalViews#IndexStrategies
1 like