



Nifty weekly chart - Technical Learning
Nifty weekly chart - Technical Learning
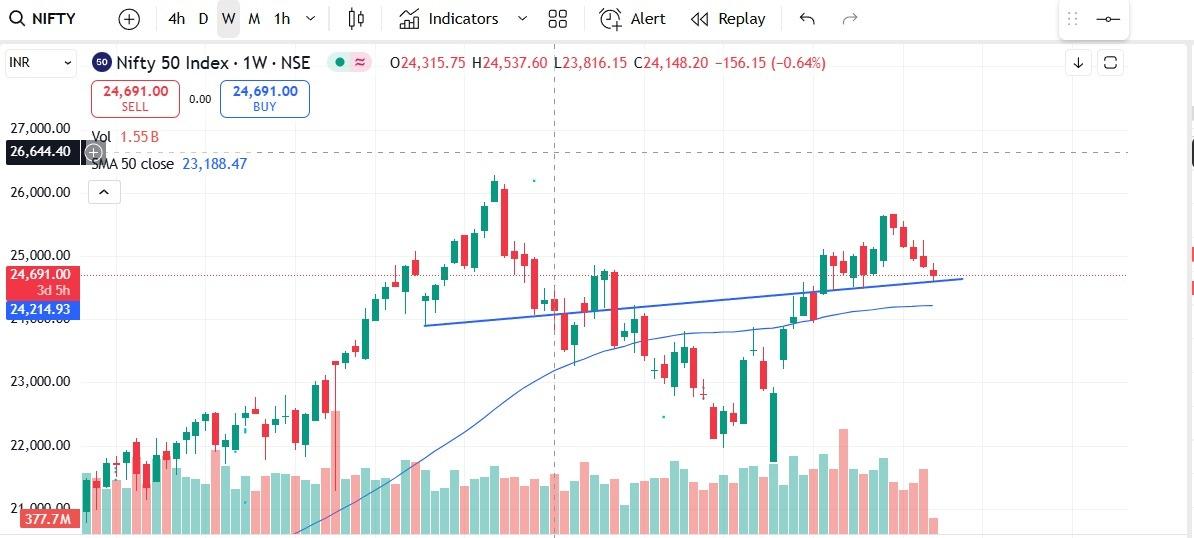
1) Nifty at a retracement level around 24500-24600.
2) Major demand zone on weekly chart
3) If market respects this level, we may see levels of 24900-24950 soon in next 2-3 days.
4) 24500-24600 needs to hold for good momentum in coming days.
5) Although we will be sideways to bearish till we are below 24900-24950.
6) Sector in focus shall be energy/Recycling theme
7) Stock on radar - TATAPOWER
Thank you,
Technofunda24
#TechnicalViews#IndexStrategies
860 likes·45 comments