



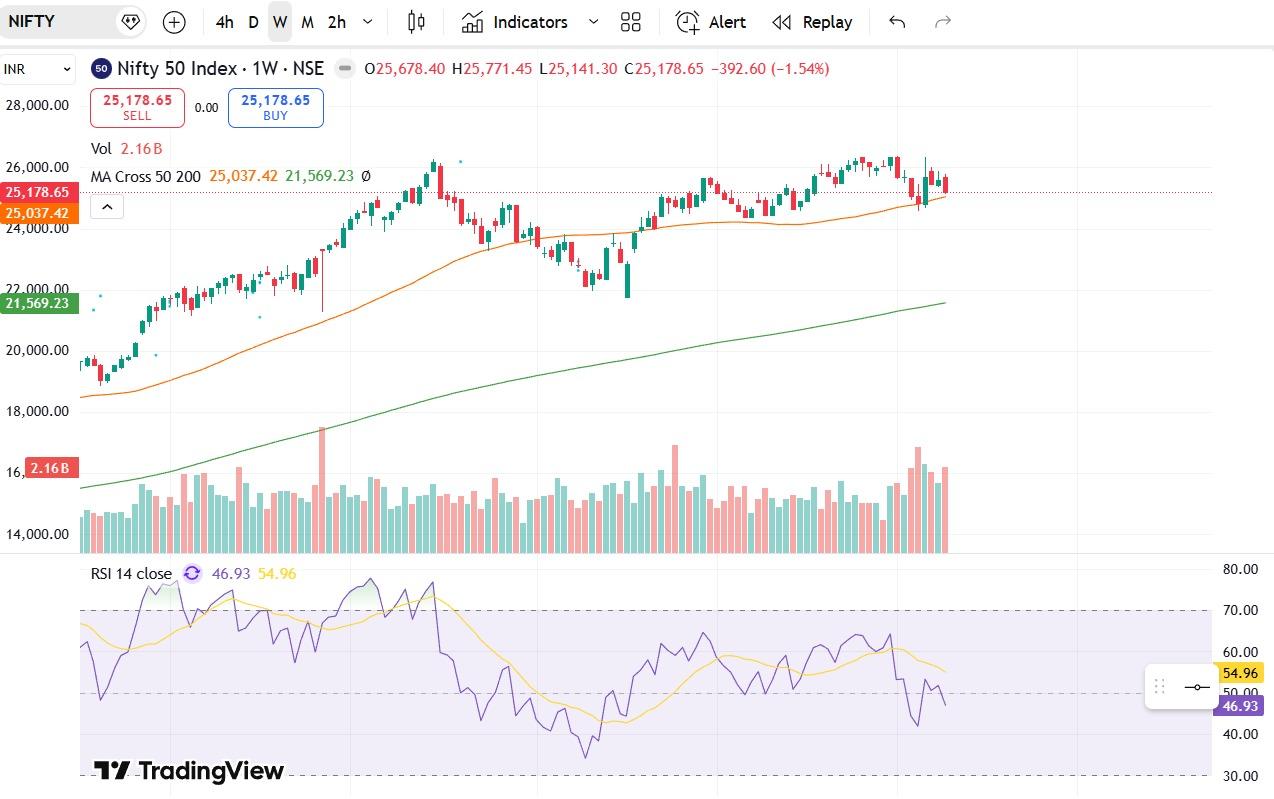
Nifty Weekly chart - Technical learning
Nifty Weekly chart - Technical learning
1) This is weekly chart
2) We are creating new lows on every week
3) Bias is negative now
4) Resistance for the nifty 25450-25500
5) Support at 25050-25000
6) Bullish sector Banking and specially PSU Banks - Stock on radar SBIN
7) Bearish sector for now is IT
8) All this is for information.
9) This is not a buy/sell recommendation.
Thank you,
Technofunda24
#TechnicalViews#WatchOutFor
479 likes·148 comments