



Stock for Technical Learning
Stock for Technical Learning - SUZLON
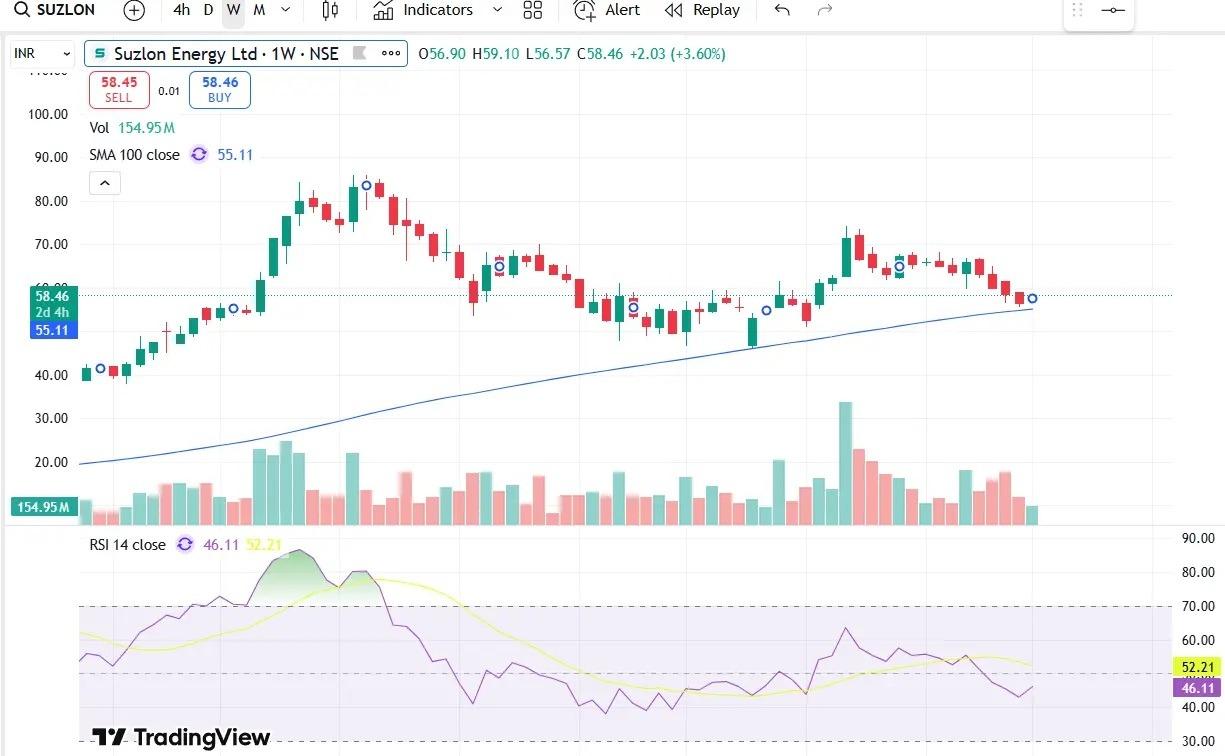
1) This is weekly chart
2) Blue line represents 100 SMA on weekly chart
3) This is crucial support zone for the stock
4) 55-57 strong demand zone on long term charts
5) Retracement already seen here
6) Stock rebounded from here.
7) All this is for information.
8) This is not a buy/sell recommendation.
9) Earlier also this was respected in recent past.
Thank you,
Technofunda24
#WatchOutFor#TechnicalViews
457 likes·72 comments