



Tata Power - Technical Learning
TATAPOWER
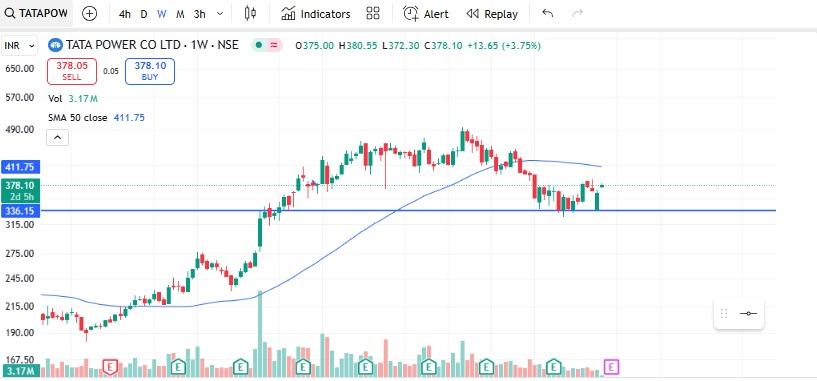
1) Chart attached in media
2)This is weekly chart
3) 340 has been working as strong support on weekly charts
4) Trendline has been drawn on the same
5) From January 2025 this has been working as very good support
6) On the upside 390 is the resistance on weekly chart
7) We see a positive move above 390
8) This is all for learning
9) This is not a buy/sell call.
Thank you,
Technofunda24
#WatchOutFor#TechnicalViews
265 likes