



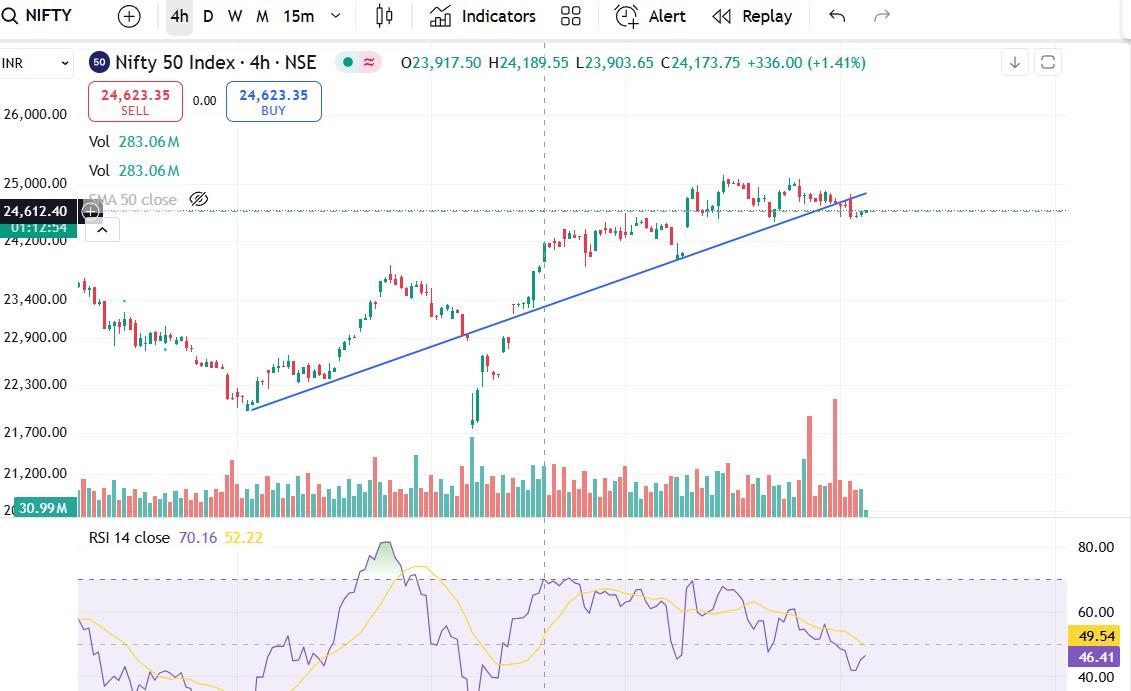
Technical chart for Nifty
Technical chart for Nifty
1) Nifty chart attached in media
2) This is 4-hour chart
3) RSI indicating sideways movement
4) Technical bias is negative below 24650
5) We believe 24650-24700 shall work as resistance now
6) Trendline drawn on charts
7) Market now trading below trendline and this indicates some weakness
8) Sector in focus is railways
9) Stock on radar - RVNL
This is not a buy/sell call. All this data is for information only.
Thank you,
Technofunda24
#IndexStrategies#WatchOutFor
277 likes·84 comments