



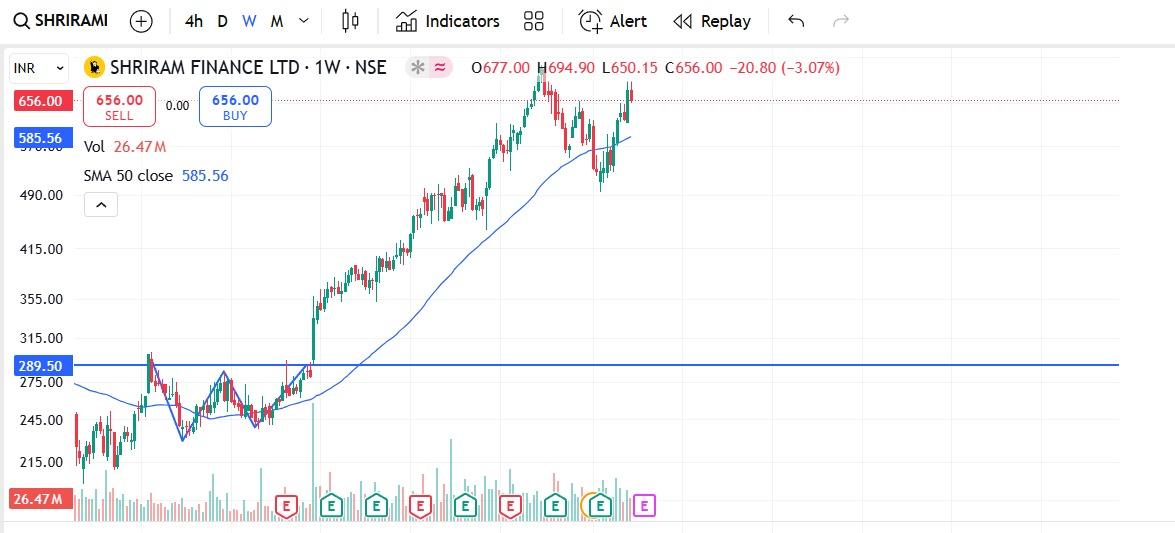
W Pattern on stock chart
W Pattern on stock chart
1) Chart attached in media - Stock on radar SHRIRAMFIN
2) This is chart for Shriram Finance
3) This is old data
4) Older then 3 months
5) We see a clear W pattern on charts - Please look at the bottom part of chart
6) We also see a strong breakout with volume
7) Very big green and positive candle after the pattern breakout
8) This is weekly chart
9) Volume is very important here. This is very strong technical pattern
10) This is neither a buy nor a sell call
Thank you,
Technofunda24
#WatchOutFor#TechnicalViews
201 likes·64 comments