‹ All Posts

Threetrend Research

Latest posts, stock views and market insights from Threetrend Research on StockGro.

SEBI-Registered Research Analyst · INH000022729 · View advisor profile

Threetrend Research

3 hours ago · SEBI Registration INH000022729

Wockhardt is showing a strong bullish technical structure

WOCKPHARMA Wockhardt is showing a strong bullish technical structure as the stock is trading above all four important EMAs 21, 55, 100 and 200 EMA, indicating positive momentum across short-term, medium-term and long-term trends. When a…

#FundamentalViews#TechnicalViews
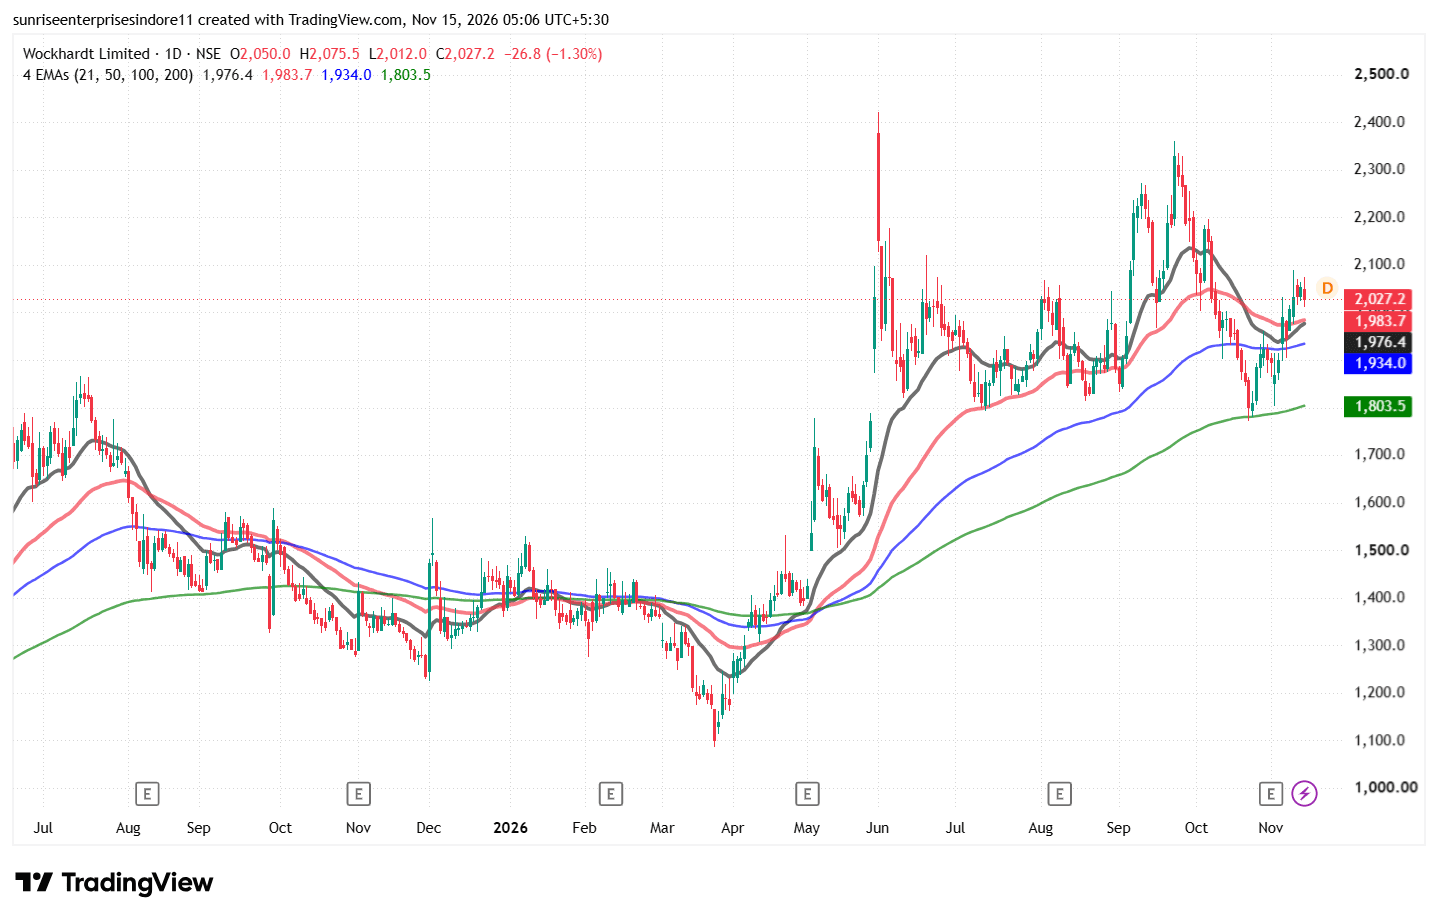
WOCKPHARMA_2026-11-15_05-06-41.png
58 likes·53 comments
Threetrend Research

10 hours ago · SEBI Registration INH000022729

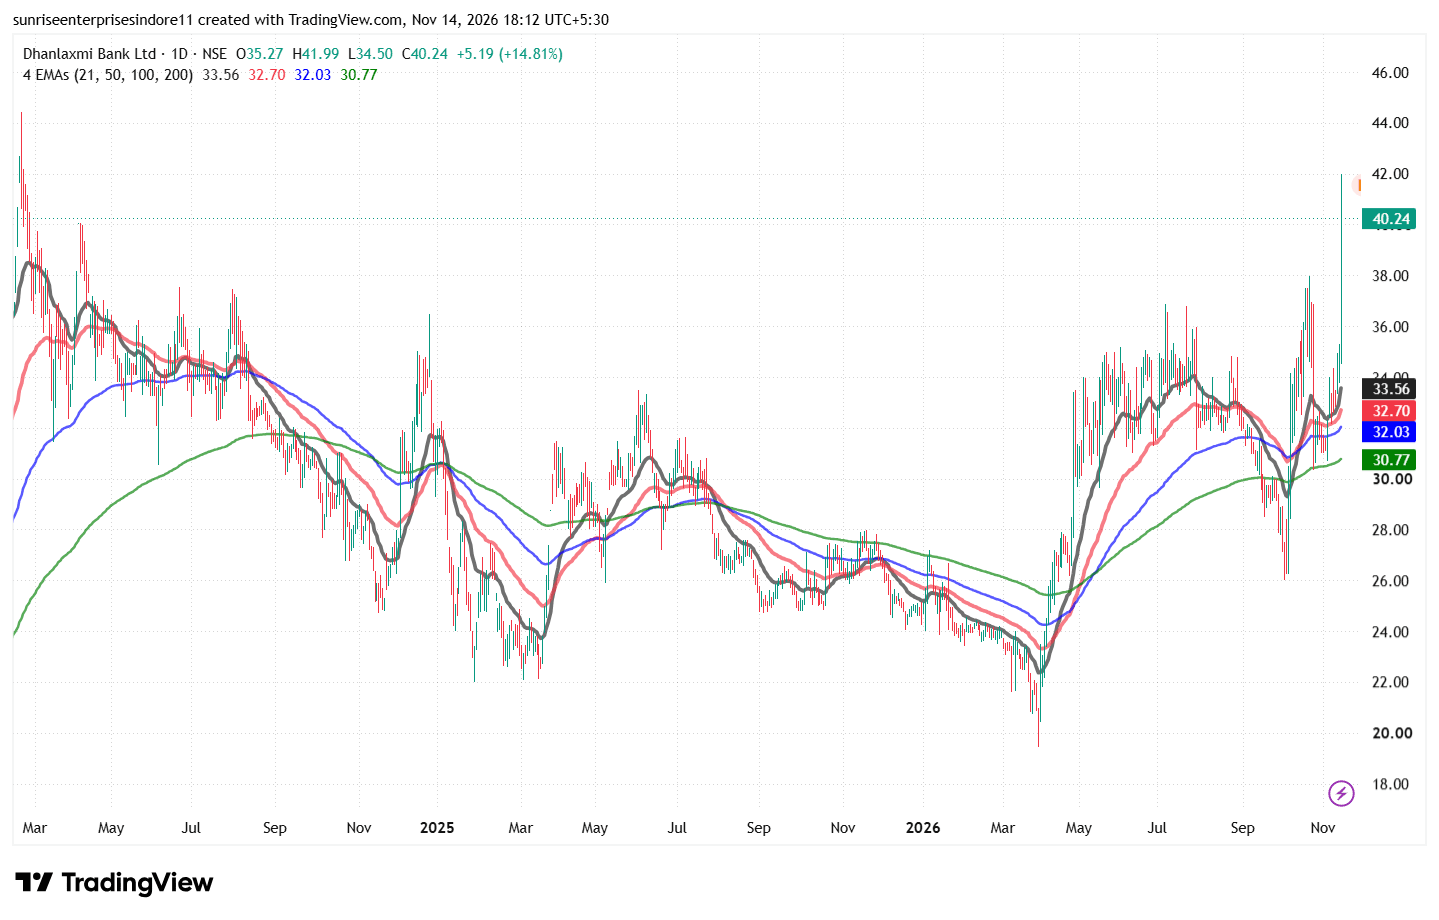
Dhanlaxmi Bank has reported strong Q2 FY27 results

DHANBANK Dhanlaxmi Bank has reported strong Q2 FY27 results, with net profit more than doubling to ₹48.55 crore compared with ₹23.20 crore in Q2 FY26, while interest income increased 23% to ₹471 crore and operating profit rose to ₹69.82…

#FundamentalViews
DHANBANK_2026-11-14_18-12-29.png
164 likes·72 comments
Threetrend Research

14 hours ago · SEBI Registration INH000022729

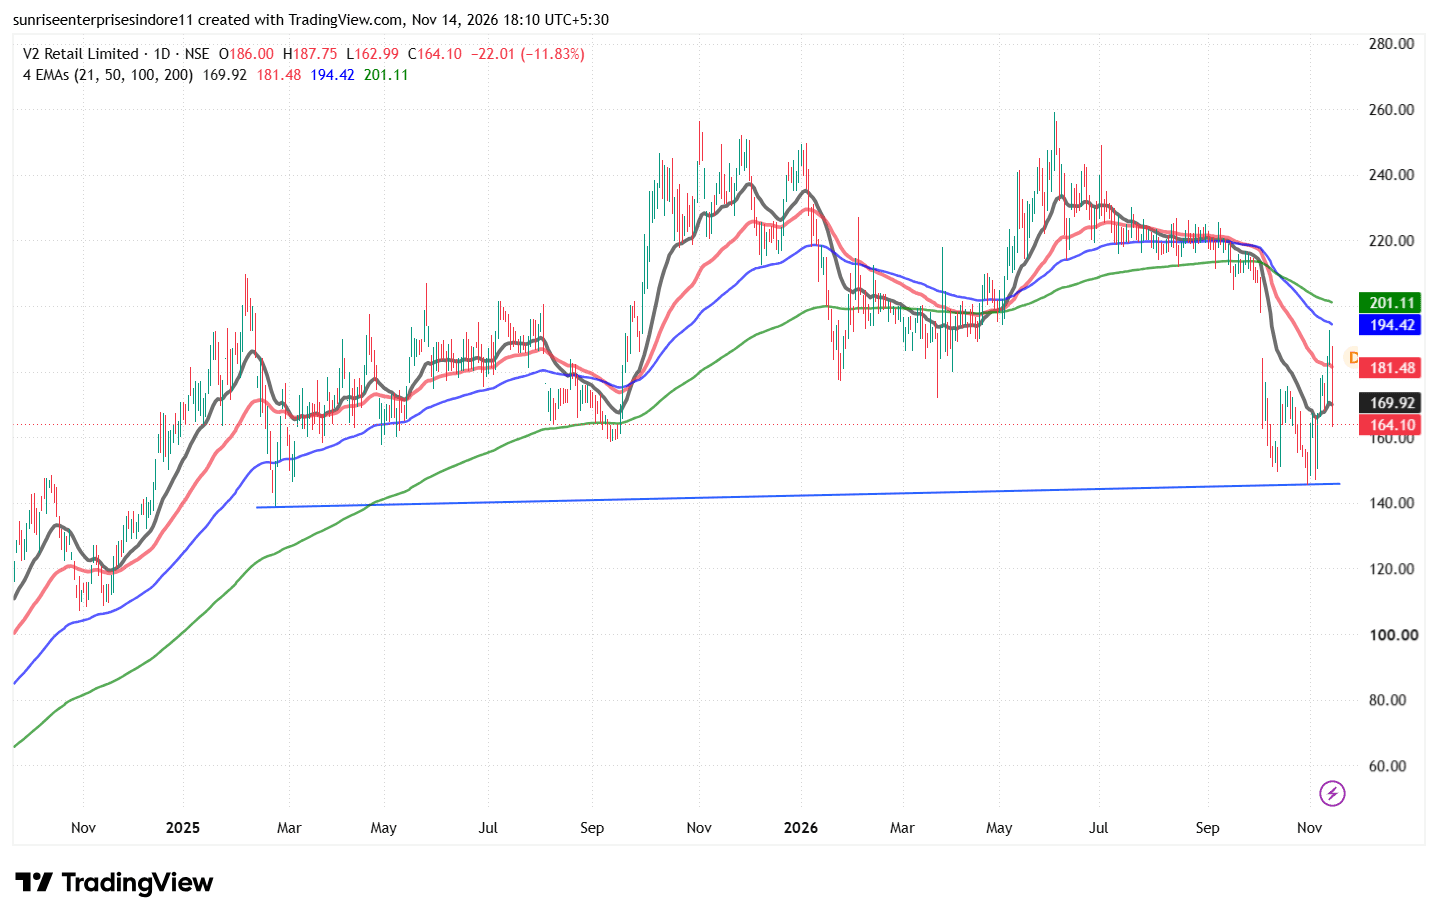
V2 Retail Ltd is showing strong business growth

V2RETAIL V2 Retail Ltd is showing strong business growth, with Q2 FY27 revenue increasing 28% YoY to ₹905.6 crore, EBITDA rising 41% to ₹120.3 crore and net profit growing 6% to ₹18.2 crore. For H1 FY27, revenue increased 42% to ₹1,902.8…

#FundamentalViews#TechnicalViews
V2RETAIL_2026-11-14_18-10-34.png
221 likes·68 comments
Threetrend Research

20 hours ago · SEBI Registration INH000022729

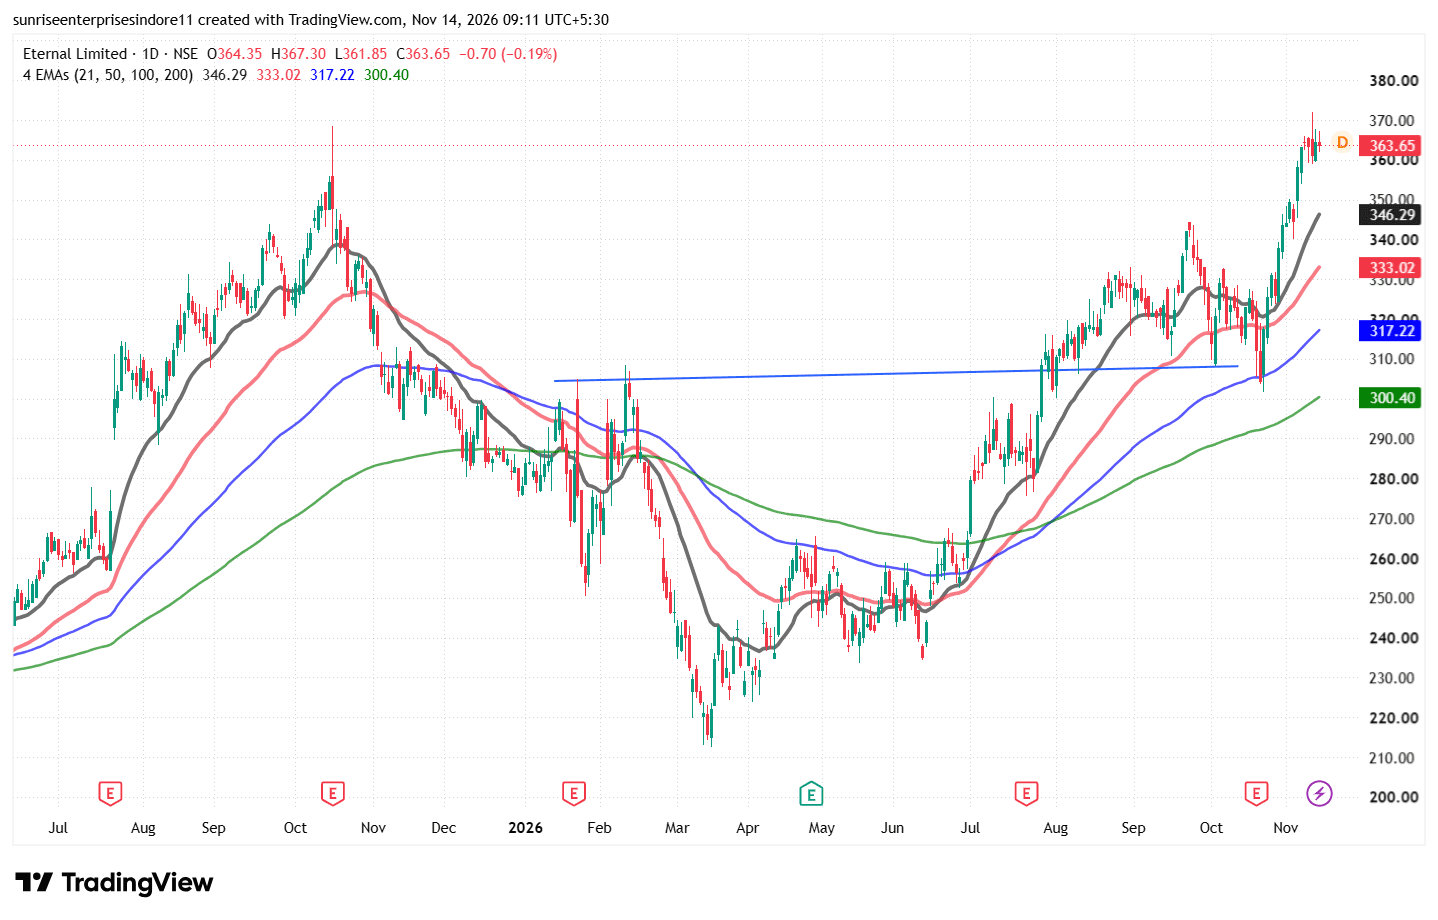
Eternal is showing a strong bullish trend on the daily chart

ETERNAL Eternal is showing a strong bullish trend on the daily chart after a prolonged correction from the ₹360–370 zone towards ₹215–220, followed by a gradual recovery and formation of higher highs and higher lows. The stock has given…

#FundamentalViews#TechnicalViews
ETERNAL_2026-11-14_09-11-40.png
313 likes·83 comments
Threetrend Research

23 hours ago · SEBI Registration INH000022729

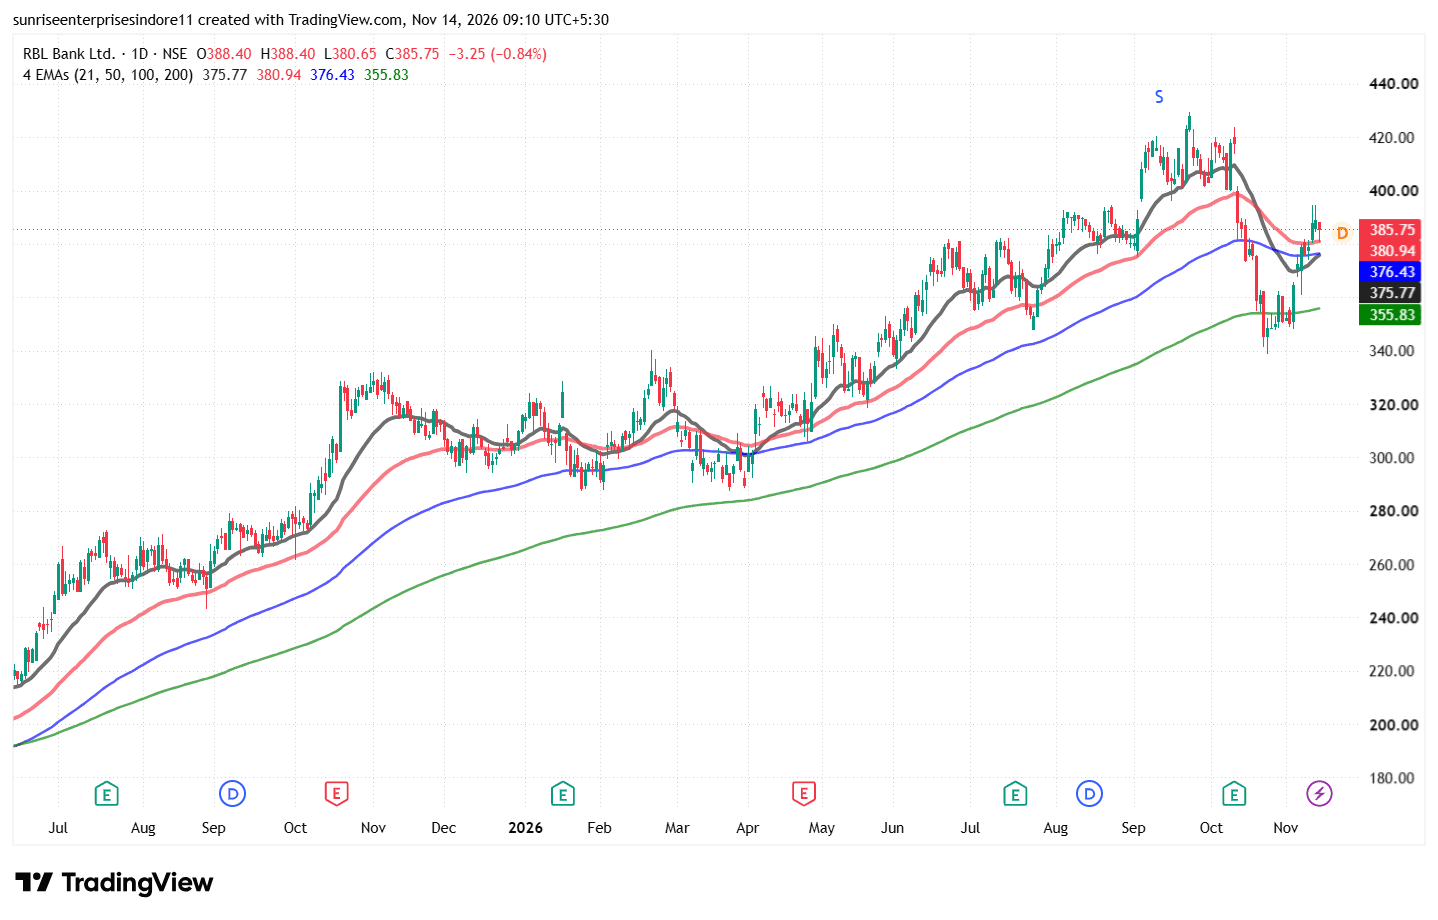
On the daily chart, RBL Bank is showing signs of recovery

RBLBANK On the daily chart, RBL Bank is showing signs of recovery after a sharp correction from the ₹420–430 zone. The stock has rebounded from the ₹345–350 support area and is currently trading around ₹385.75, above its 21 EMA (₹375.77…

#FundamentalViews#TechnicalViews
RBLBANK_2026-11-14_09-10-01.png
352 likes·58 comments
Threetrend Research

14th Nov · SEBI Registration INH000022729

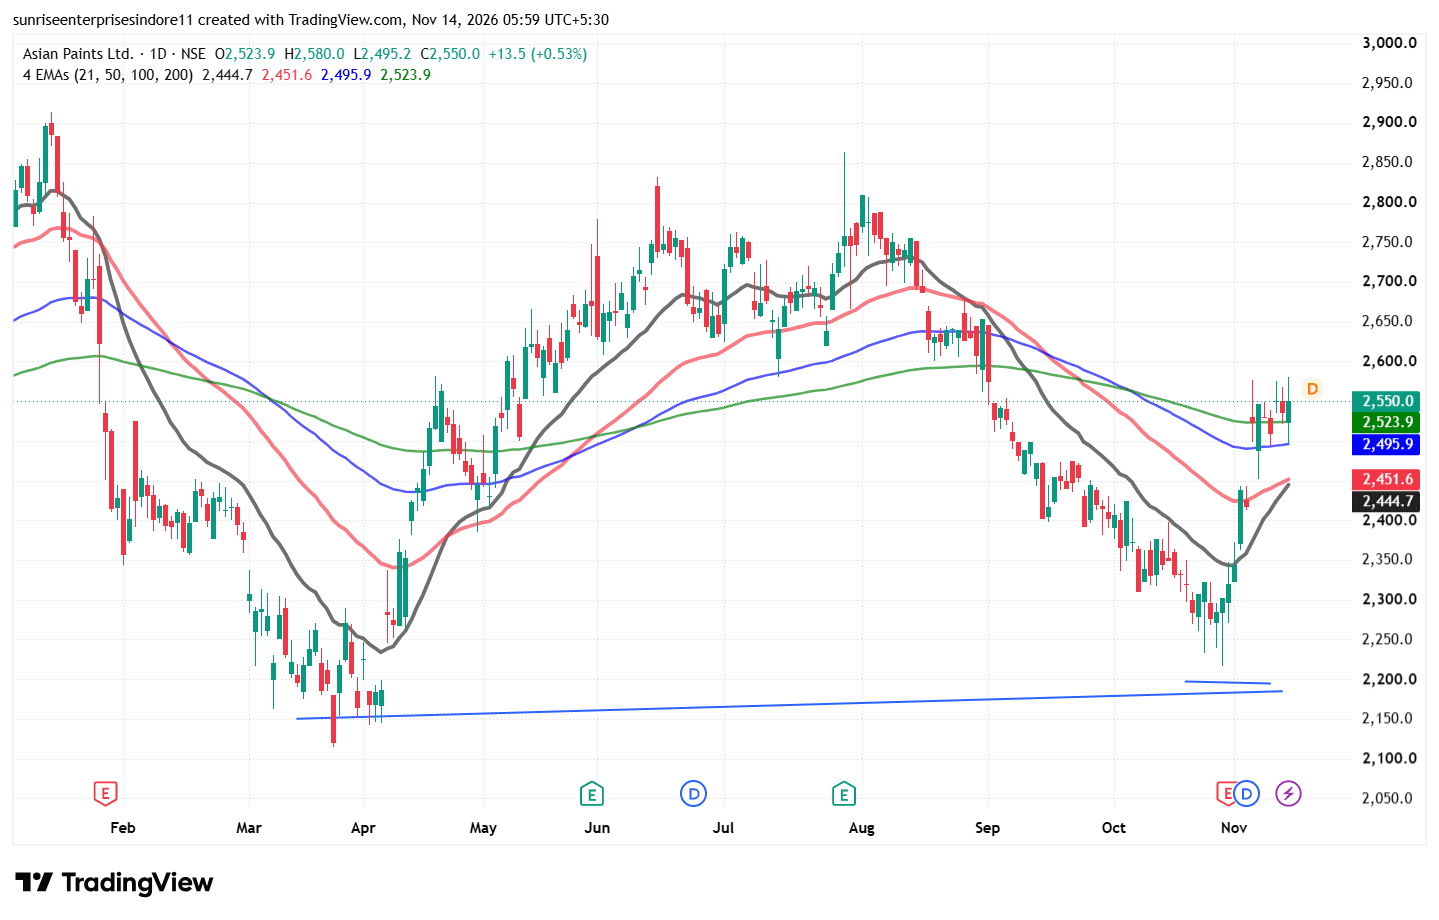
Asian Paints is showing a bullish technical indication

ASIANPAINT Asian Paints is showing a bullish technical indication as a Bullish Pin Bar forms near the trendline support zone, suggesting that buyers are stepping in and rejecting lower price levels. The long lower wick reflects buying pr…

#FundamentalViews#TechnicalViews
ASIANPAINT_2026-11-14_05-59-33.png
402 likes·71 comments
Threetrend Research

13th Nov · SEBI Registration INH000022729

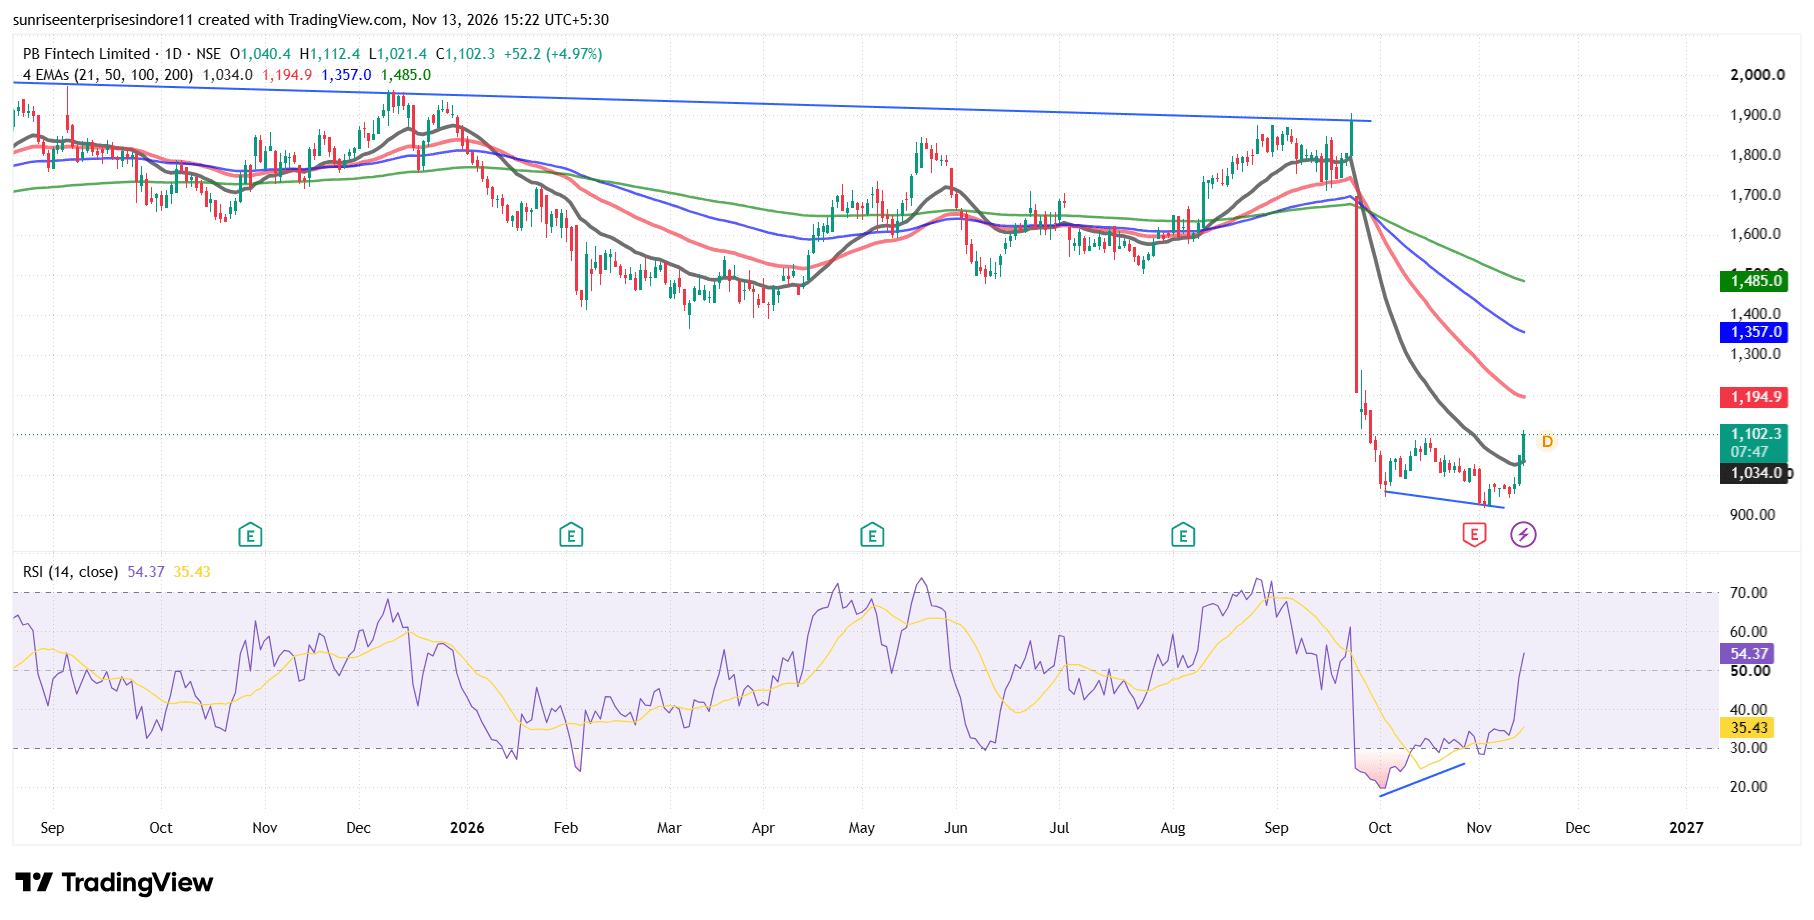
Classical Positive Divergence is a bullish technica

POLICYBZR Classical Positive Divergence is a bullish technical indicator that occurs when the stock price makes a lower low (LL), while the RSI or another momentum indicator forms a higher low (HL). This indicates that although the price…

#FundamentalViews#TechnicalViews
POLICYBZR_2026-11-13_15-22-13.png
532 likes·44 comments
Threetrend Research

13th Nov · SEBI Registration INH000022729

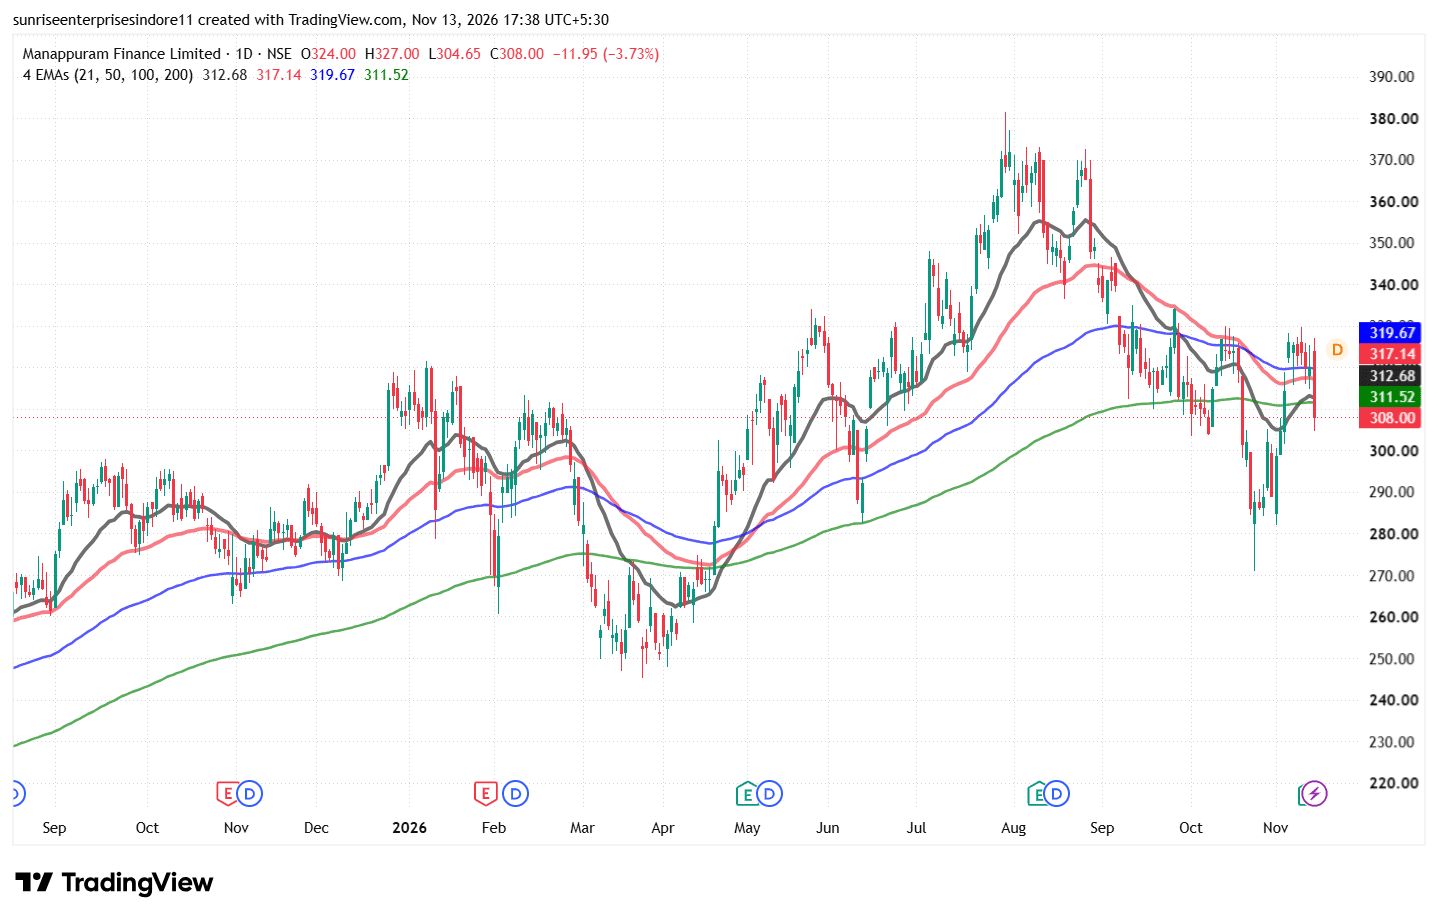
Manappuram Finance looks technically weak

MANAPPURAM Manappuram Finance looks technically weak on the daily chart, closing at ₹308, down 3.73%, below its 21-, 50-, 100- and 200-day EMAs. Immediate support lies at ₹304–300; a sustained breakdown could expose ₹290–280, while ₹312–…

#TechnicalViews
MANAPPURAM_2026-11-13_17-38-10.png
574 likes·86 comments
Threetrend Research

13th Nov · SEBI Registration INH000022729

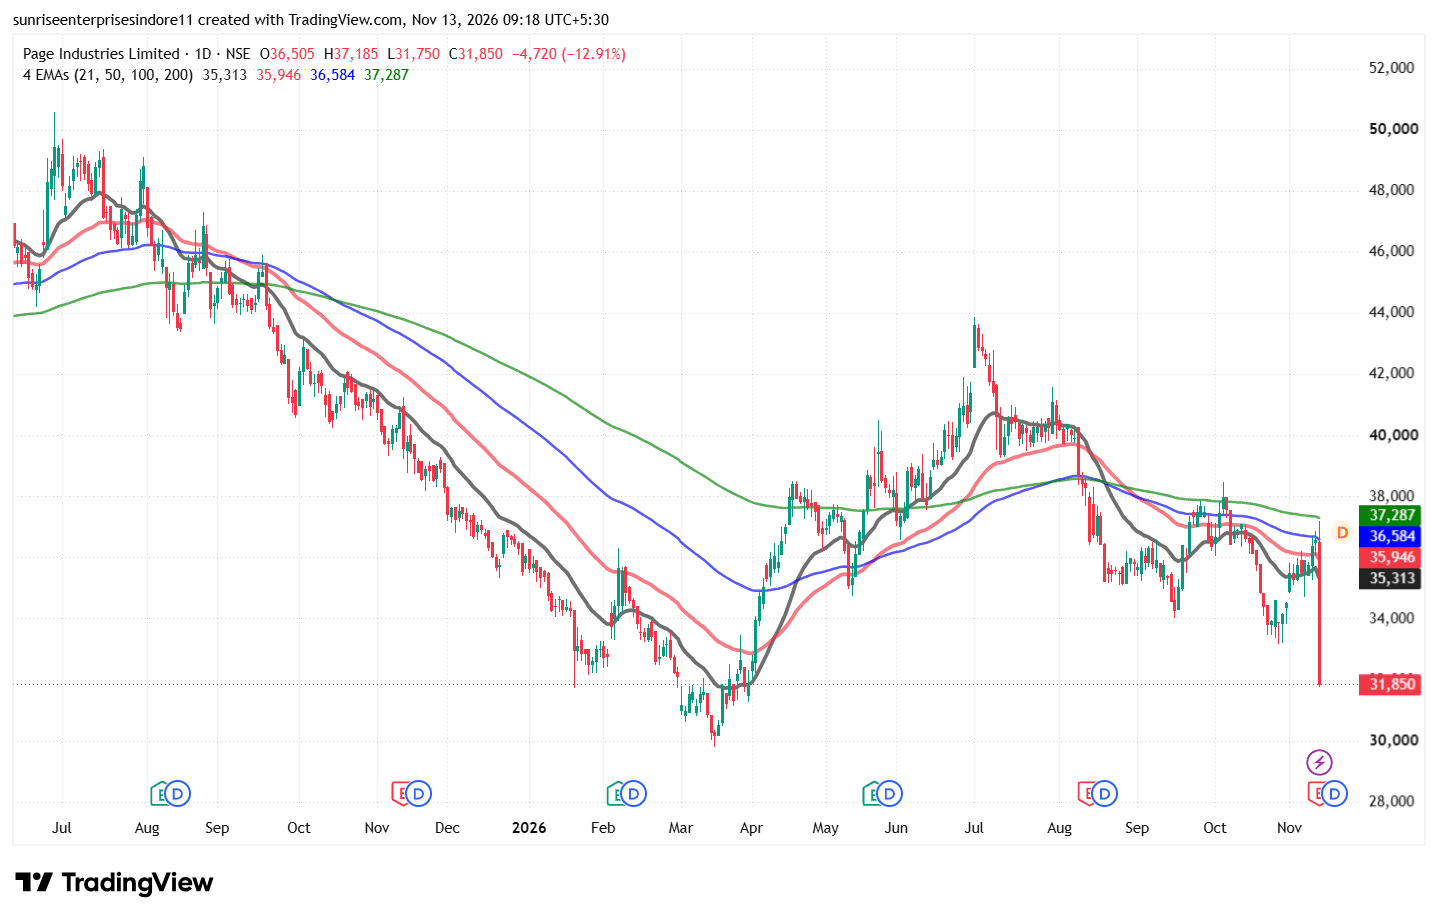
The stock is witnessing strong selling pressure

PAGEIND The stock is witnessing strong selling pressure, falling nearly 12.91% to ₹31,850 in the latest session. Technically, the stock is trading below all four important EMAs — 21 EMA (₹35,313), 50 EMA (₹35,946), 100 EMA (₹36,584) and…

#FundamentalViews#TechnicalViews
PAGEIND_2026-11-13_09-18-00.png
655 likes·47 comments
Threetrend Research

13th Nov · SEBI Registration INH000022729

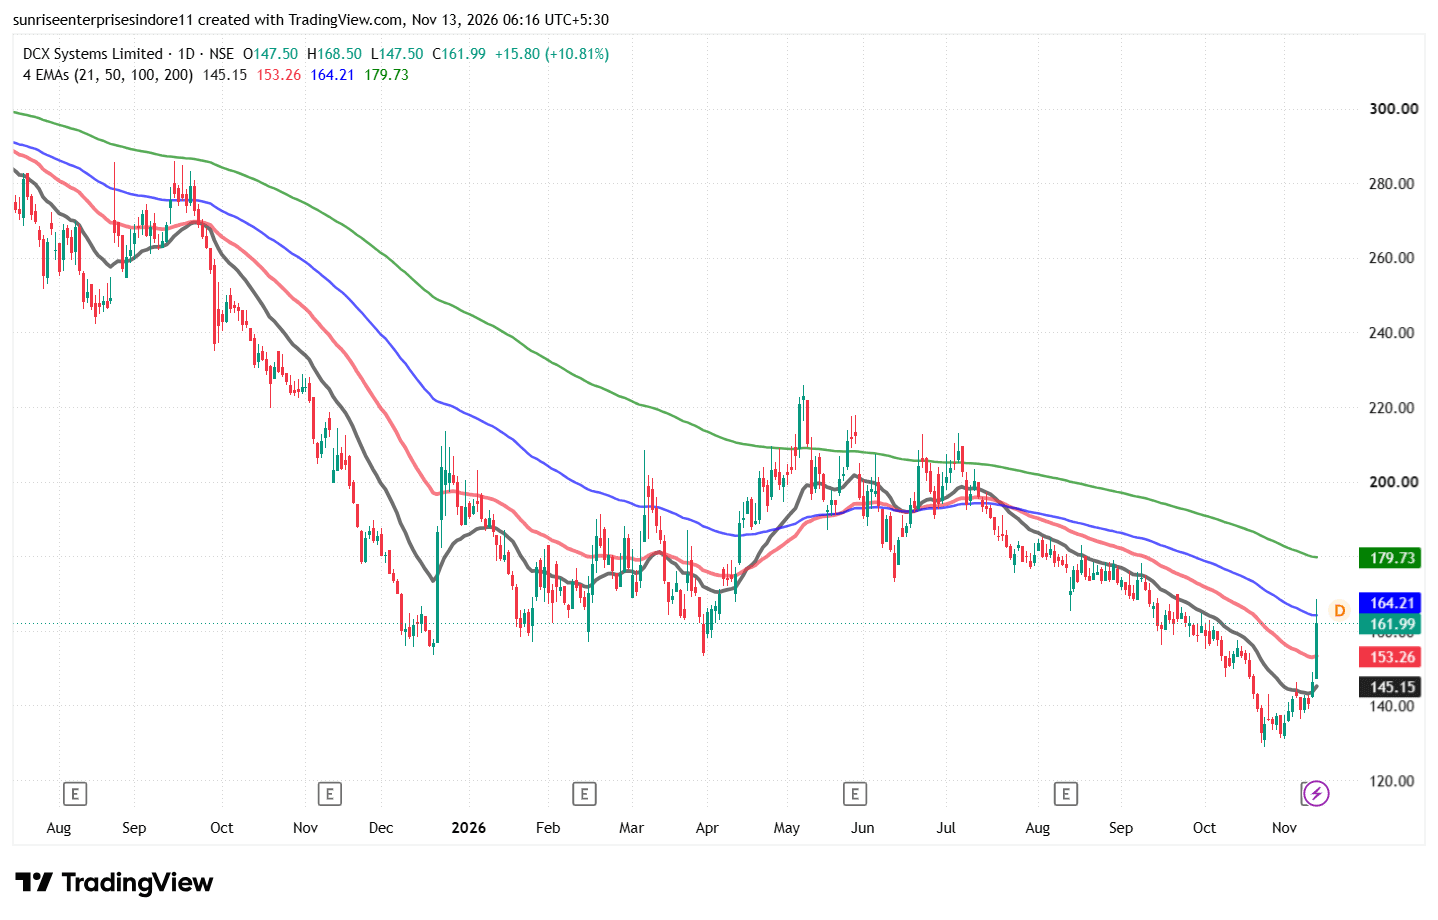
DCX Systems is showing a strong recovery on the daily chart

DCXINDIA DCX Systems is showing a strong recovery on the daily chart, with the stock gaining around 10.81% to close at ₹161.99. The latest bullish candle indicates strong buying interest after a prolonged decline and has pushed the price…

#FundamentalViews#TechnicalViews
DCXINDIA_2026-11-13_06-16-11.png
710 likes·61 comments
Threetrend Research

13th Nov · SEBI Registration INH000022729

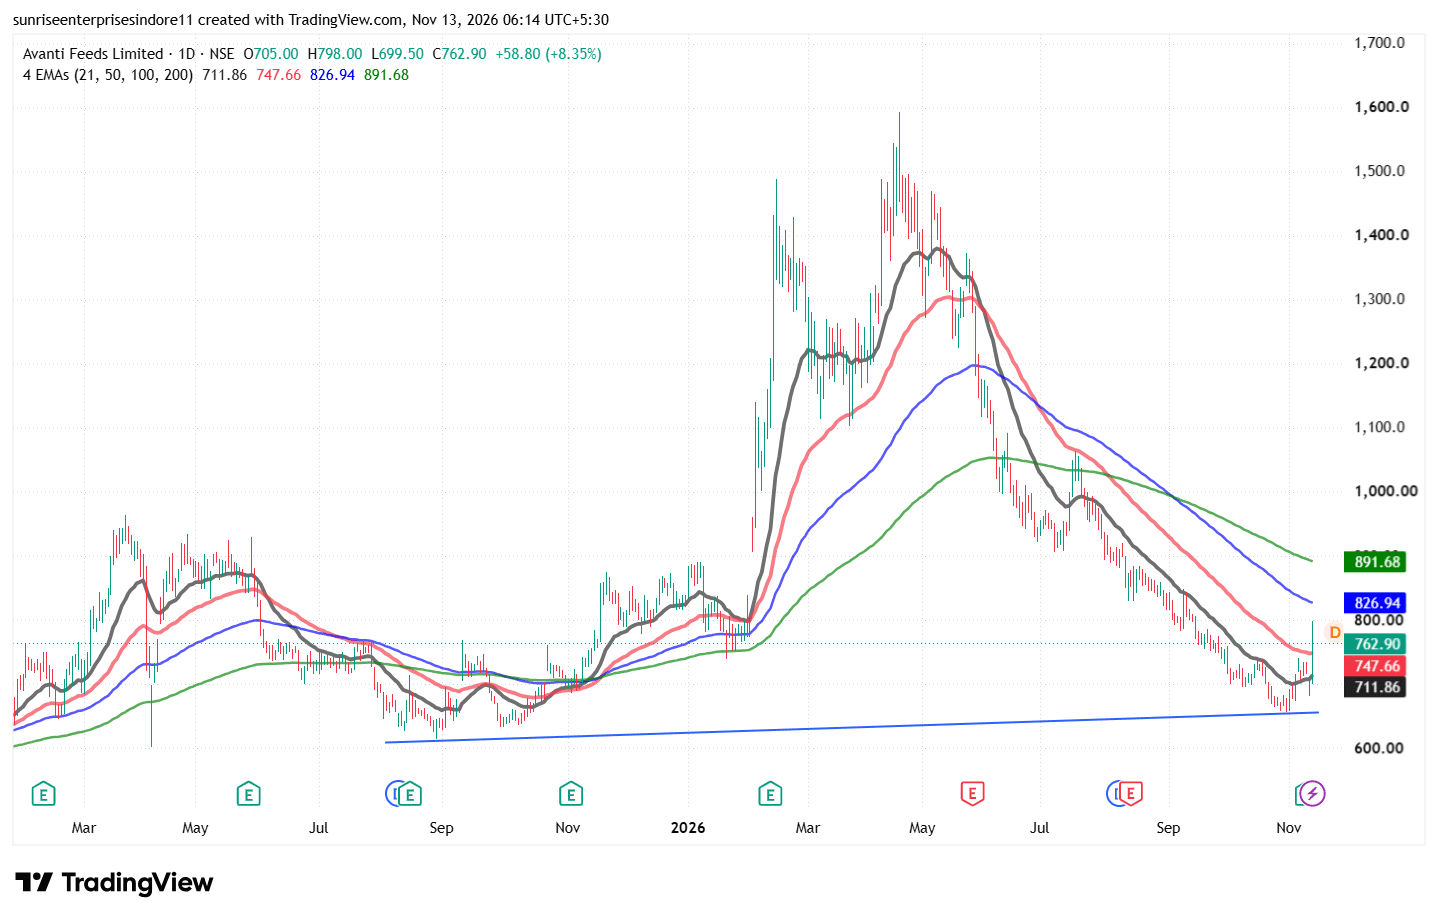
A Bullish Engulfing Pattern at a Trendline Support Zone

AVANTIFEED A Bullish Engulfing Pattern at a Trendline Support Zone is considered a strong potential bullish reversal signal because it combines two important technical indicators. When the price approaches an upward-sloping trendline sup…

#FundamentalViews#TechnicalViews
AVANTIFEED_2026-11-13_06-14-38.png
762 likes·74 comments
Threetrend Research

12th Nov · SEBI Registration INH000022729

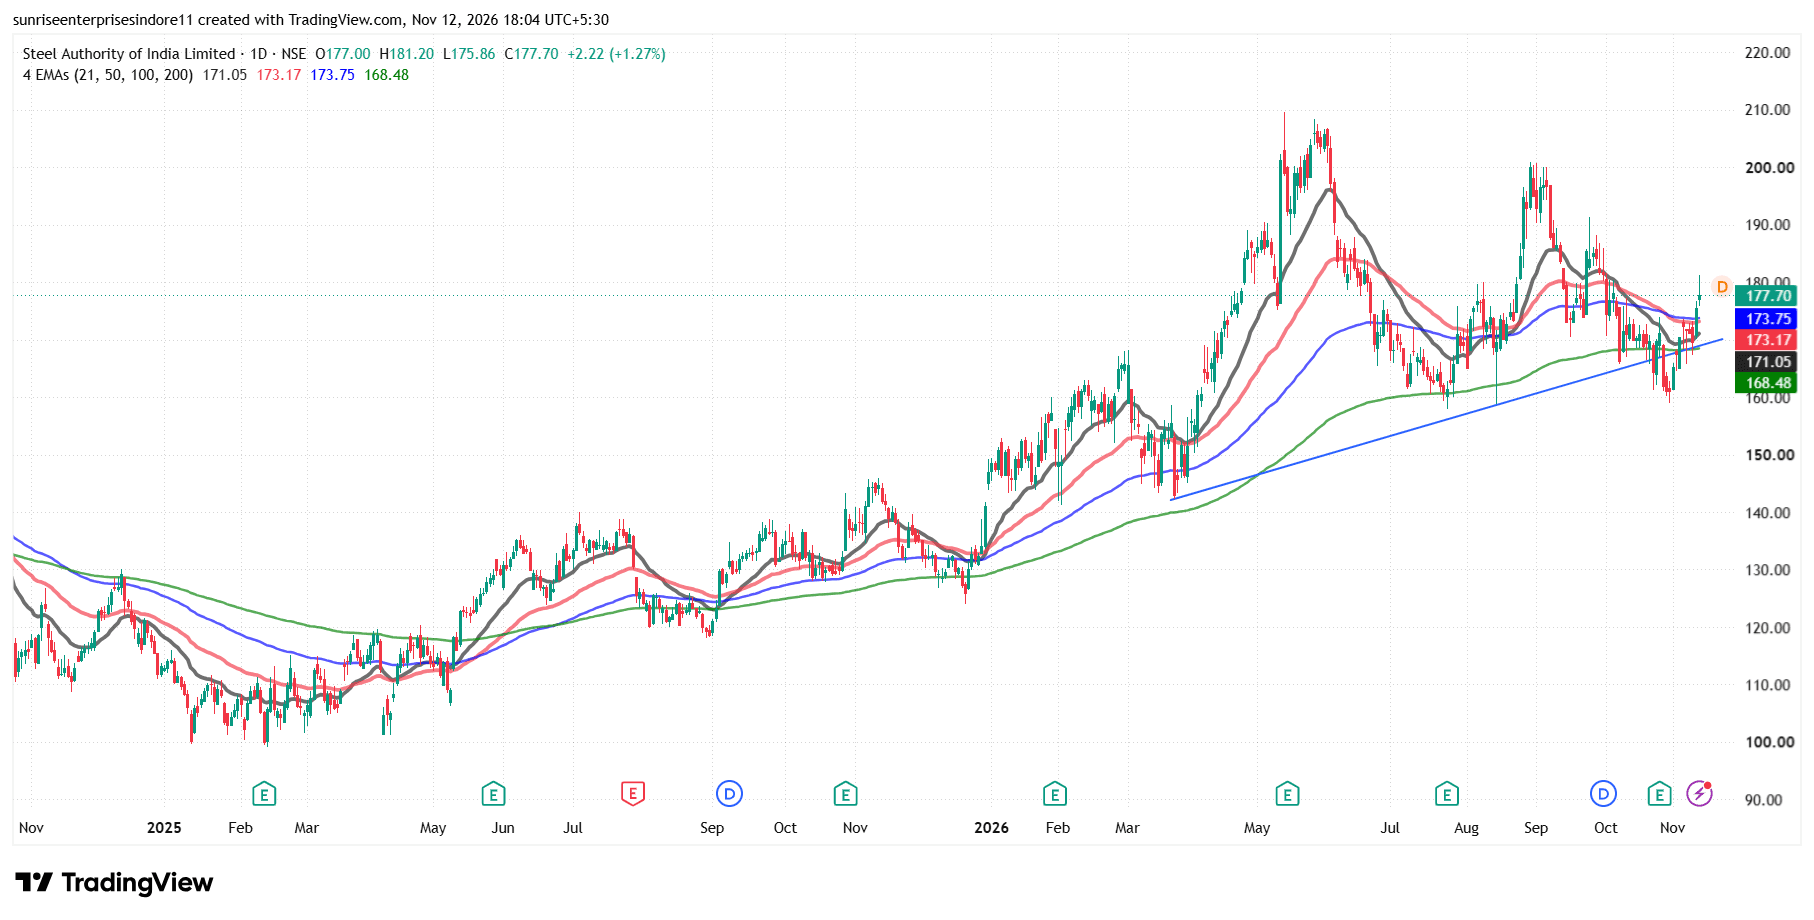
(SAIL) is showing a strong bullish technical structure

SAIL (SAIL) is showing a strong bullish technical structure as the stock is trading above all four important EMAs — 21, 55, 100 and 200 EMA. This alignment indicates strength across short-term, medium-term and long-term trends, with the…

#TechnicalViews#FundamentalViews
SAIL_2026-11-12_18-04-31.png
891 likes·83 comments
Threetrend Research

12th Nov · SEBI Registration INH000022729

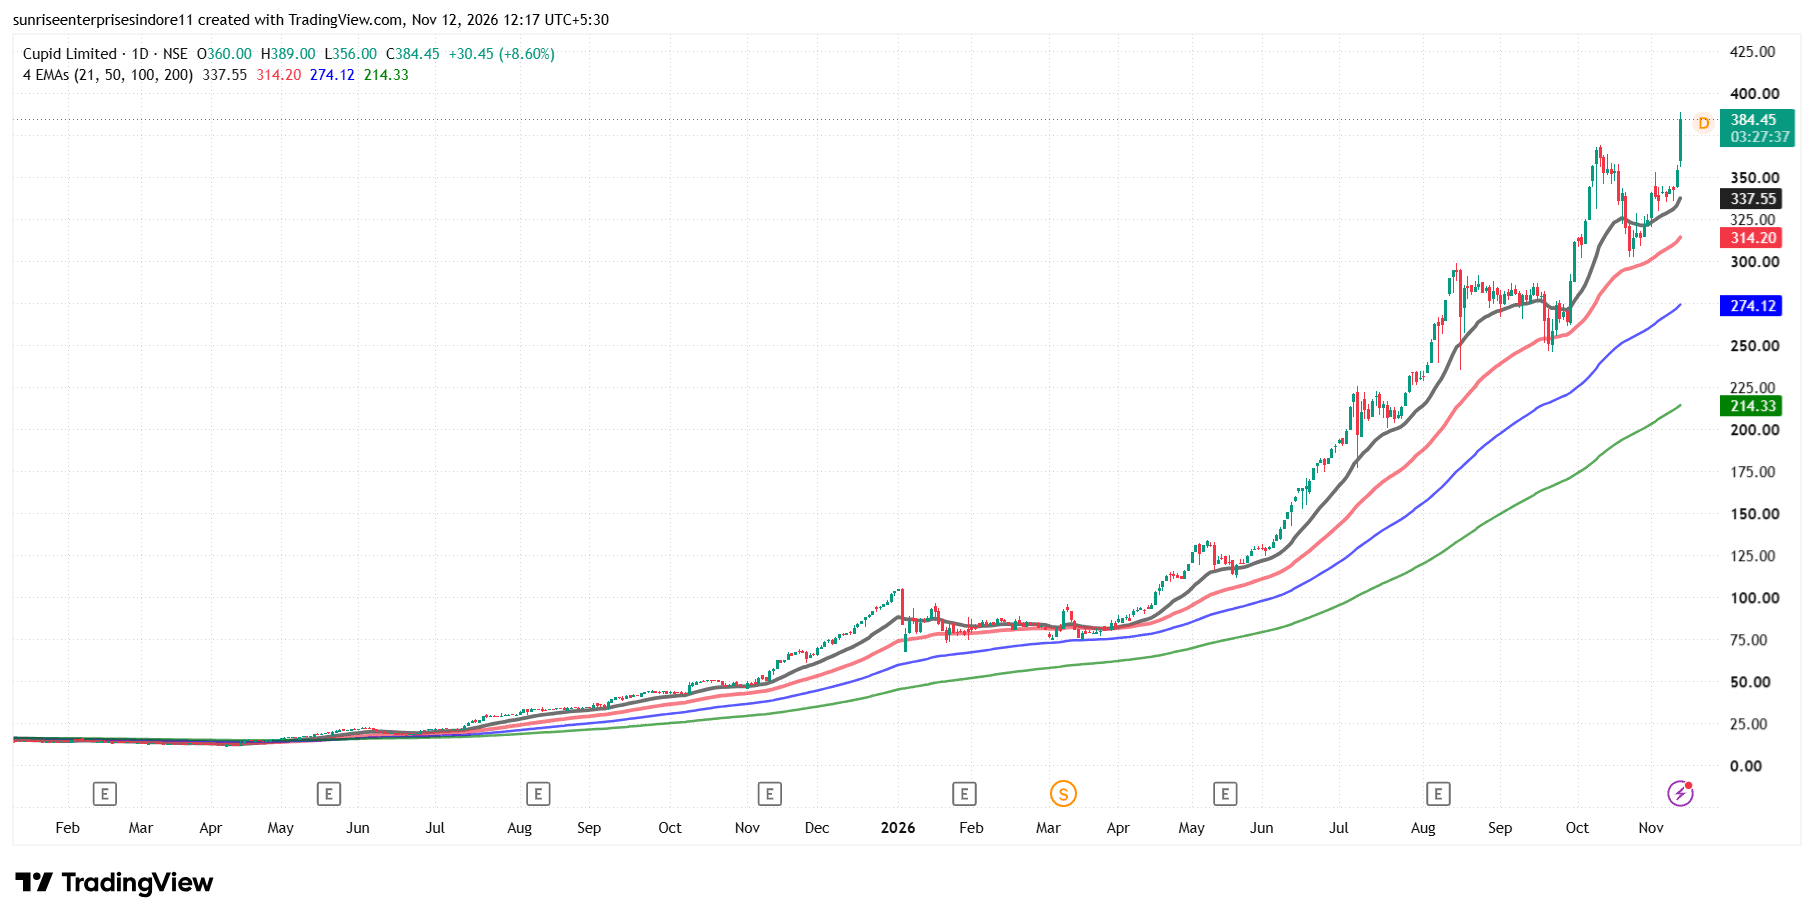
The 200 EMA is one of the most important

CUPID The 200 EMA (Exponential Moving Average) is one of the most important long-term trend indicators used in technical analysis because it helps identify the overall direction and strength of a stock. When a stock trades above its 200…

#TechnicalViews#FundamentalViews
CUPID_2026-11-12_12-17-21.png
933 likes·71 comments
Threetrend Research

12th Nov · SEBI Registration INH000022729

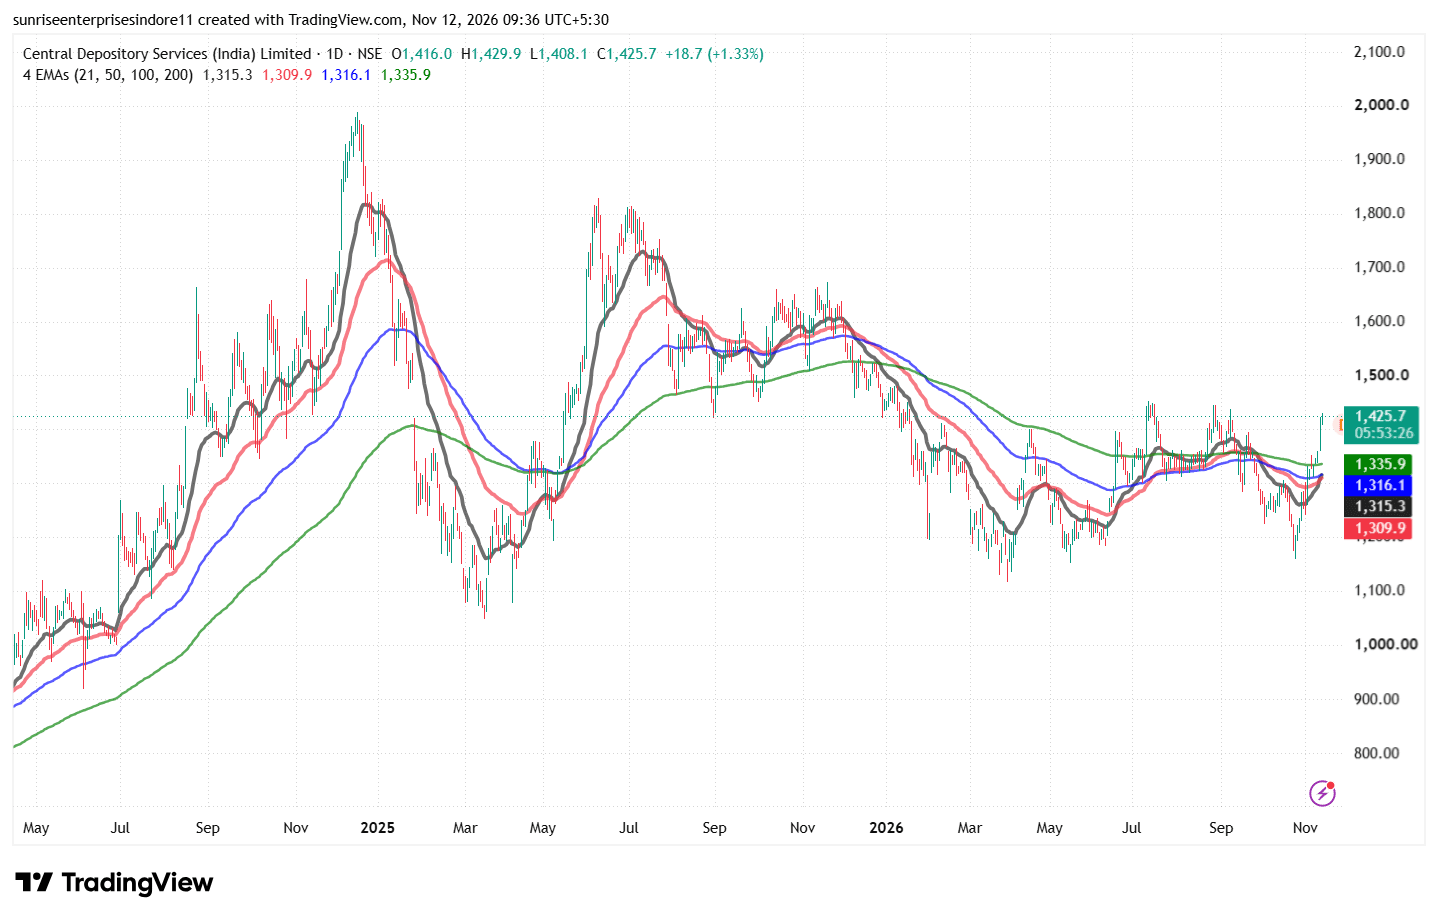
CDSL remains an important beneficiary of India's growing

CDSL CDSL remains an important beneficiary of India's growing equity-market participation, rising Demat account openings and increasing retail investor activity. The company released its Q2 FY27 and half-year financial results on 31 Octo…

#FundamentalViews#TechnicalViews
CDSL_2026-11-12_09-36-33.png
1,002 likes·56 comments
Threetrend Research

12th Nov · SEBI Registration INH000022729

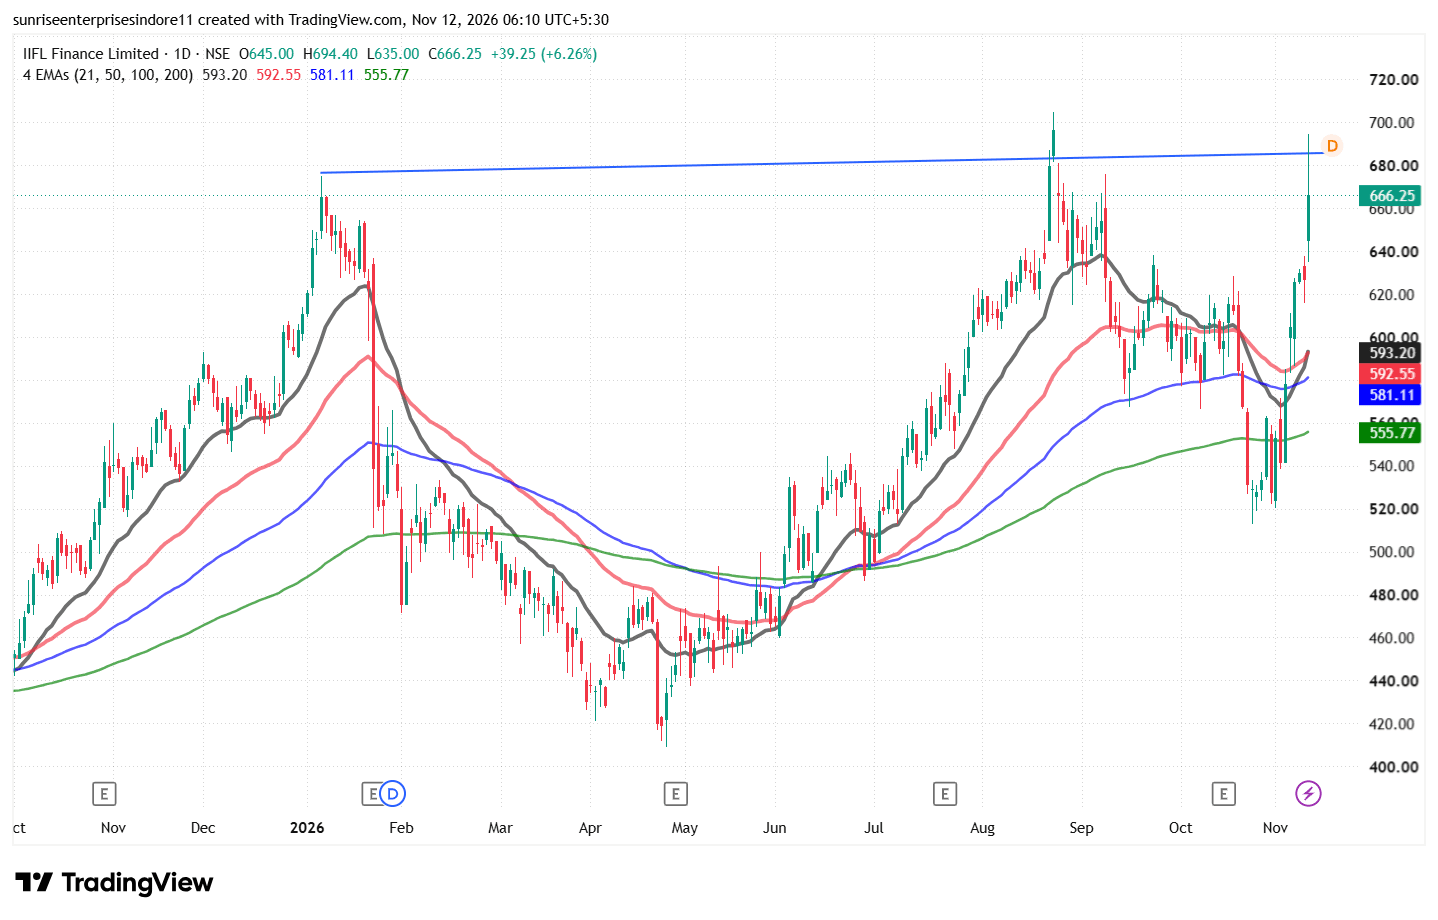
IIFL Finance is showing a positive technical structure,

IIFL IIFL Finance is showing a positive technical structure, with the stock trading above all four important EMAs (21, 55, 100 and 200), indicating strength across short-, medium- and long-term trends. The alignment of these moving avera…

#FundamentalViews#TechnicalViews
IIFL_2026-11-12_06-10-17.png
1,075 likes·91 comments
Threetrend Research

12th Nov · SEBI Registration INH000022729

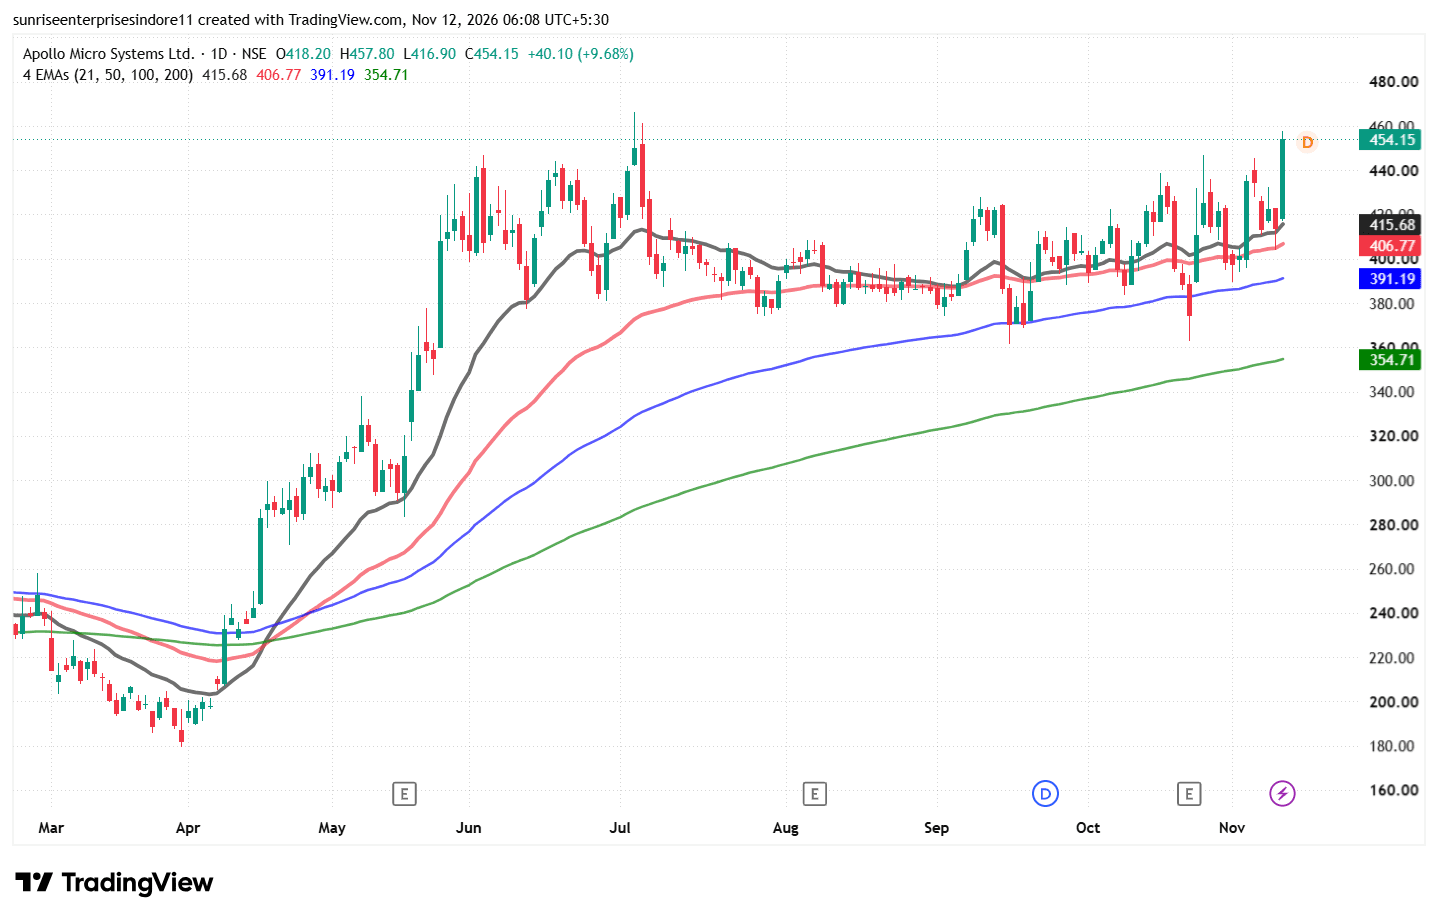
Apollo Micro Systems is showing strong bullish momentum

APOLLO Apollo Micro Systems is showing strong bullish momentum on the daily chart, with the stock surging nearly 9.68% and trading at ₹454.15. The most positive indication is that the price is trading comfortably above all four important…

#FundamentalViews#TechnicalViews
APOLLO_2026-11-12_06-08-40.png
1,110 likes·69 comments
Threetrend Research

11th Nov · SEBI Registration INH000022729

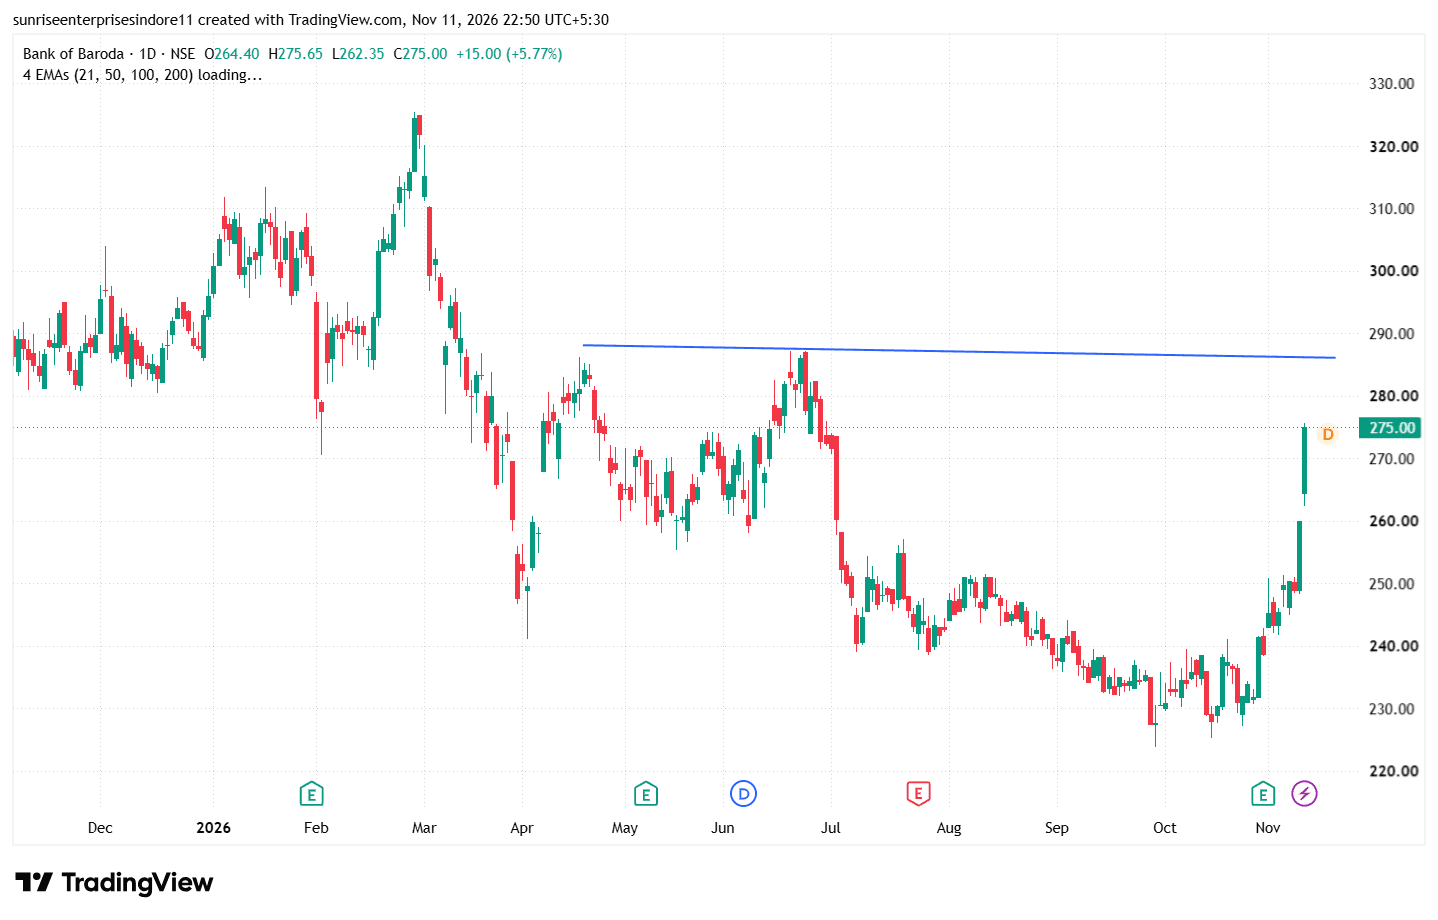
Bank of Baroda is showing strong bullish momentum

BANKBARODA Bank of Baroda is showing strong bullish momentum on the daily chart after forming a potential reversal base near the ₹230–235 zone. The stock has witnessed a sharp recovery with consecutive bullish candles and has moved above…

#FundamentalViews#TechnicalViews
BANKBARODA_2026-11-11_22-50-54.png
1,151 likes·90 comments
Threetrend Research

11th Nov · SEBI Registration INH000022729

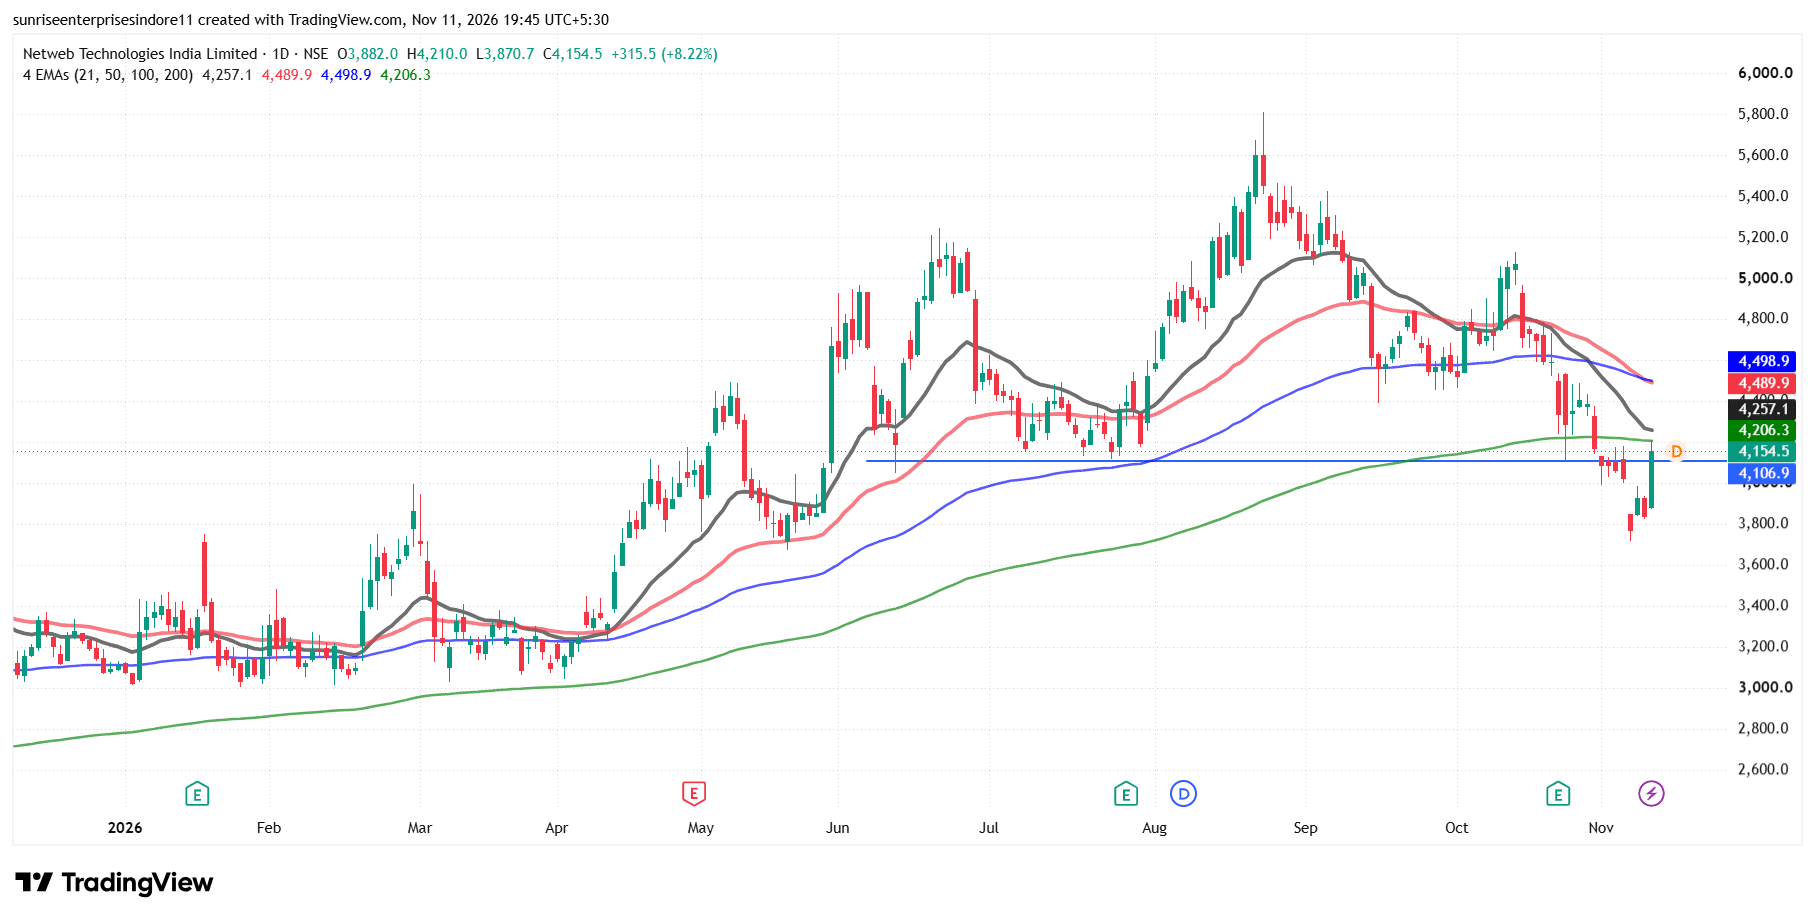
Netweb Technologies India Ltd has reported an exceptionally

NETWEB Netweb Technologies India Ltd has reported an exceptionally strong Q2 FY27 performance, with revenue rising 335.7% YoY to ₹1,323 crore and net profit increasing 335.4% to approximately ₹137 crore, while EBITDA grew 334% to ₹197 cr…

#FundamentalViews#TechnicalViews
NETWEB_2026-11-11_19-45-44.png
830 likes·62 comments
Threetrend Research

11th Nov · SEBI Registration INH000022729

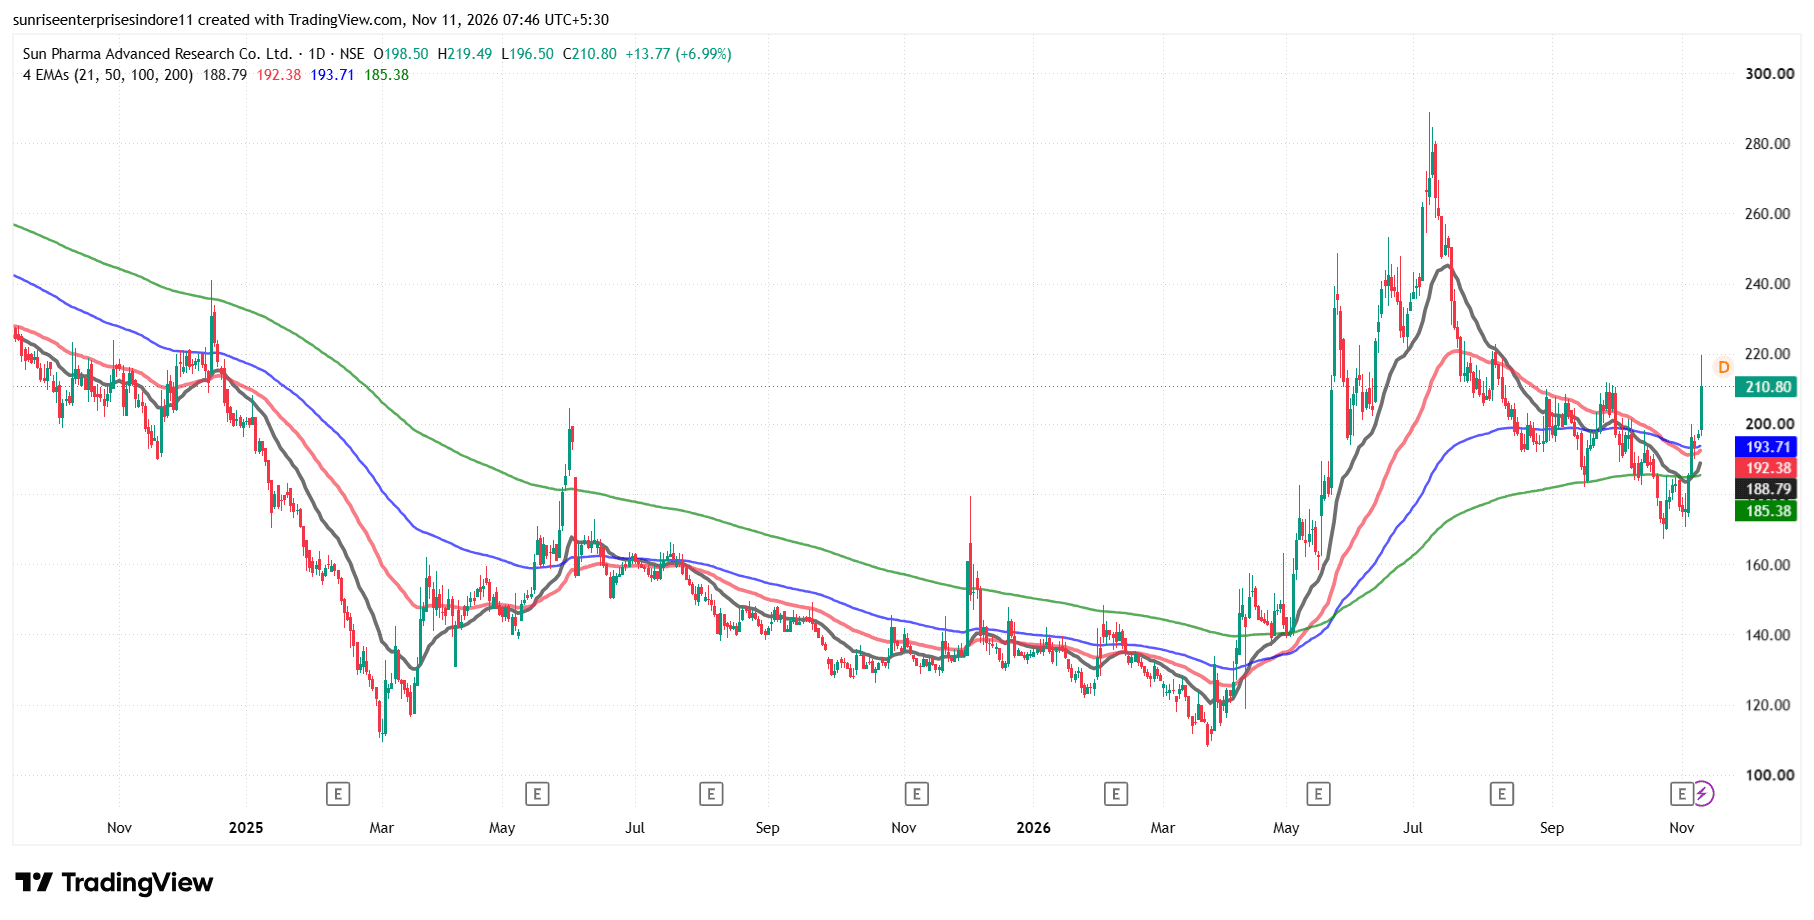
SPARC has encouraging revenue growth and potential

SPARC Sun Pharma Advanced Research Company (SPARC) is a pharmaceutical R&D company focused on developing innovative medicines and speciality treatments. In its latest Q2 FY27 results, the company reported revenue from operations of appro…

#TechnicalViews#FundamentalViews
SPARC_2026-11-11_07-46-24.png
1,216 likes·92 comments
Threetrend Research

11th Nov · SEBI Registration INH000022729

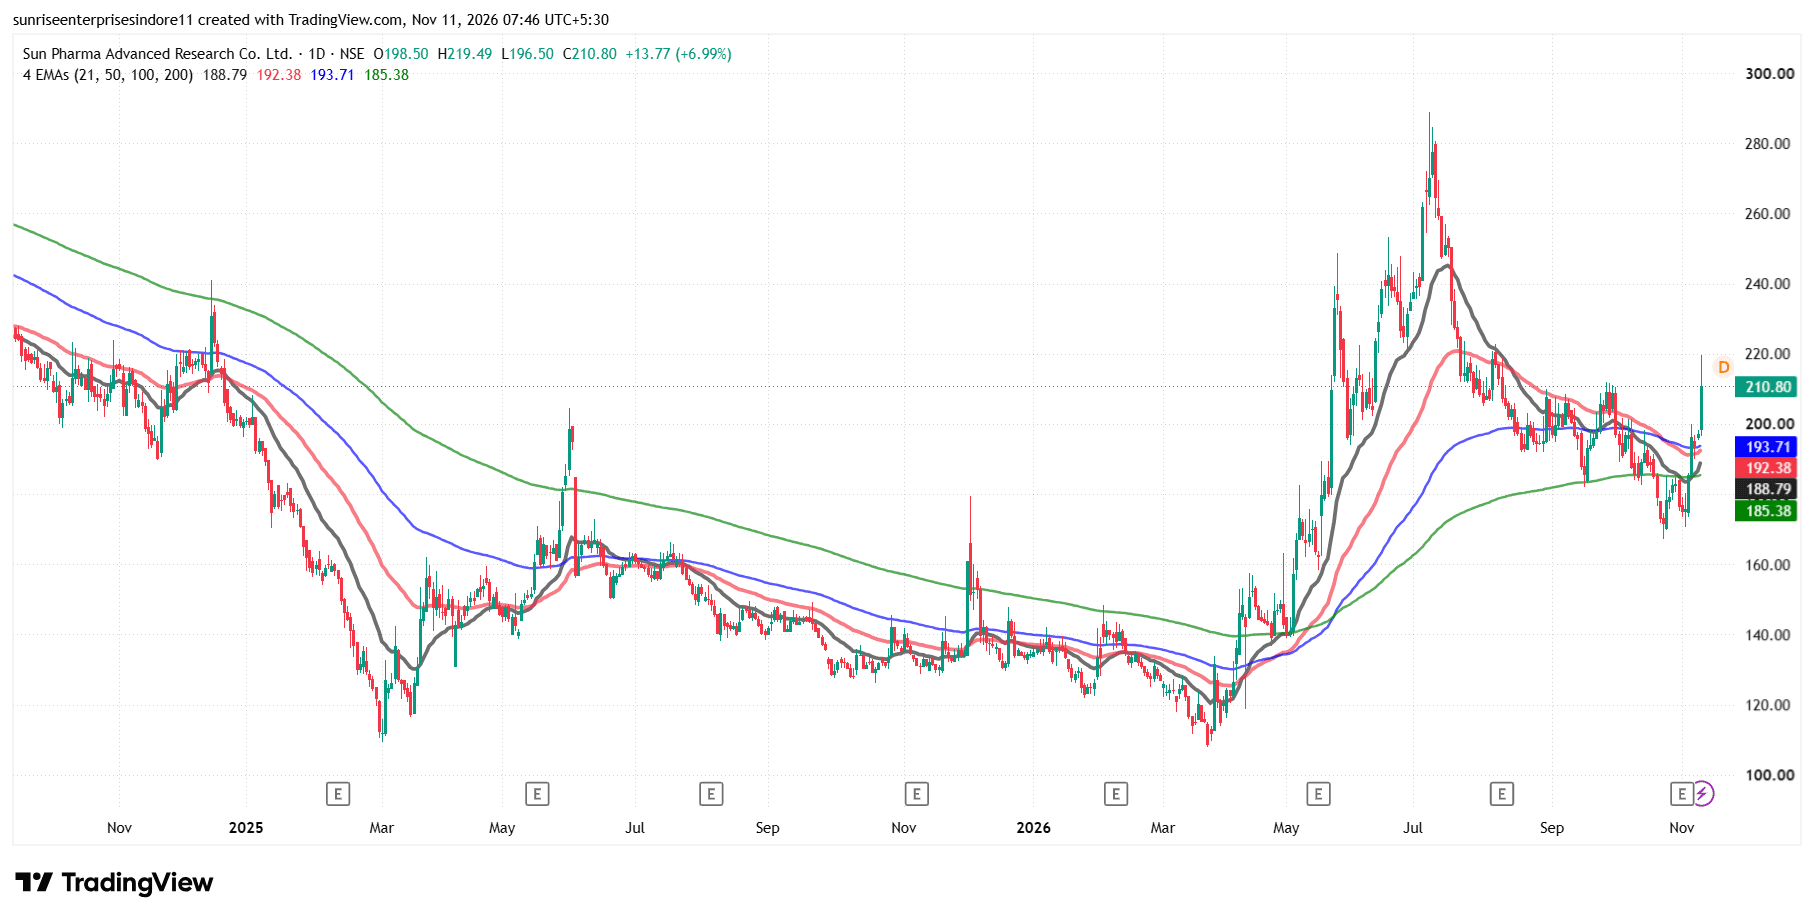
When a stock trades above all four EMAs (21, 50, 100 and 200

SPARC When a stock trades above all four EMAs (21, 50, 100 and 200), it indicates strong bullish momentum and a healthy overall trend across short-, medium- and long-term timeframes. The 21 EMA reflects short-term momentum, 50 EMA indica…

#FundamentalViews#TechnicalViews
SPARC_2026-11-11_07-46-24.png
805 likes·63 comments