


Ascending triangle
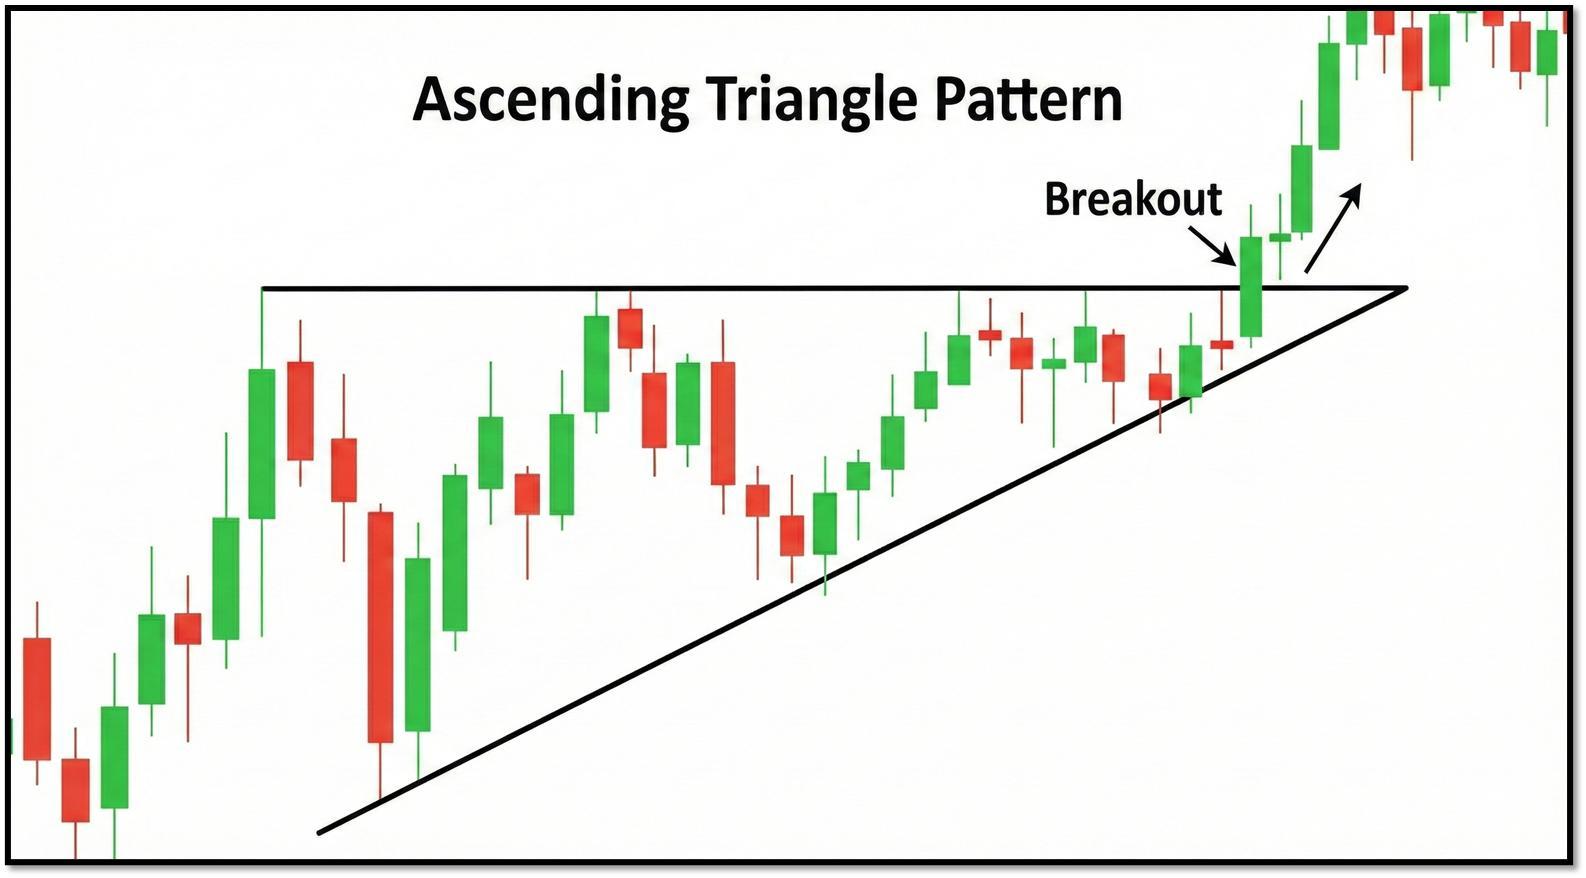
DIXON An ascending triangle is a bullish chart pattern formed by a horizontal resistance line at the top and a rising trendline connecting higher lows. It indicates that buyers are gradually gaining strength while sellers continue defending the same resistance level. As the price compresses within the pattern, a breakout above the resistance with strong trading volume signals a potential continuation of the uptrend. Traders often wait for a breakout confirmation and a successful retest of the resistance-turned-support before initiating long positions, as this helps reduce the risk of false breakouts.
#FundamentalViews#TechnicalViews
1,011 likes·71 comments