Bharti Airtel Technical and Fundamental Analysis
Bharti Airtel – Technical + Fundamental Analysis
📊 Technical Analysis
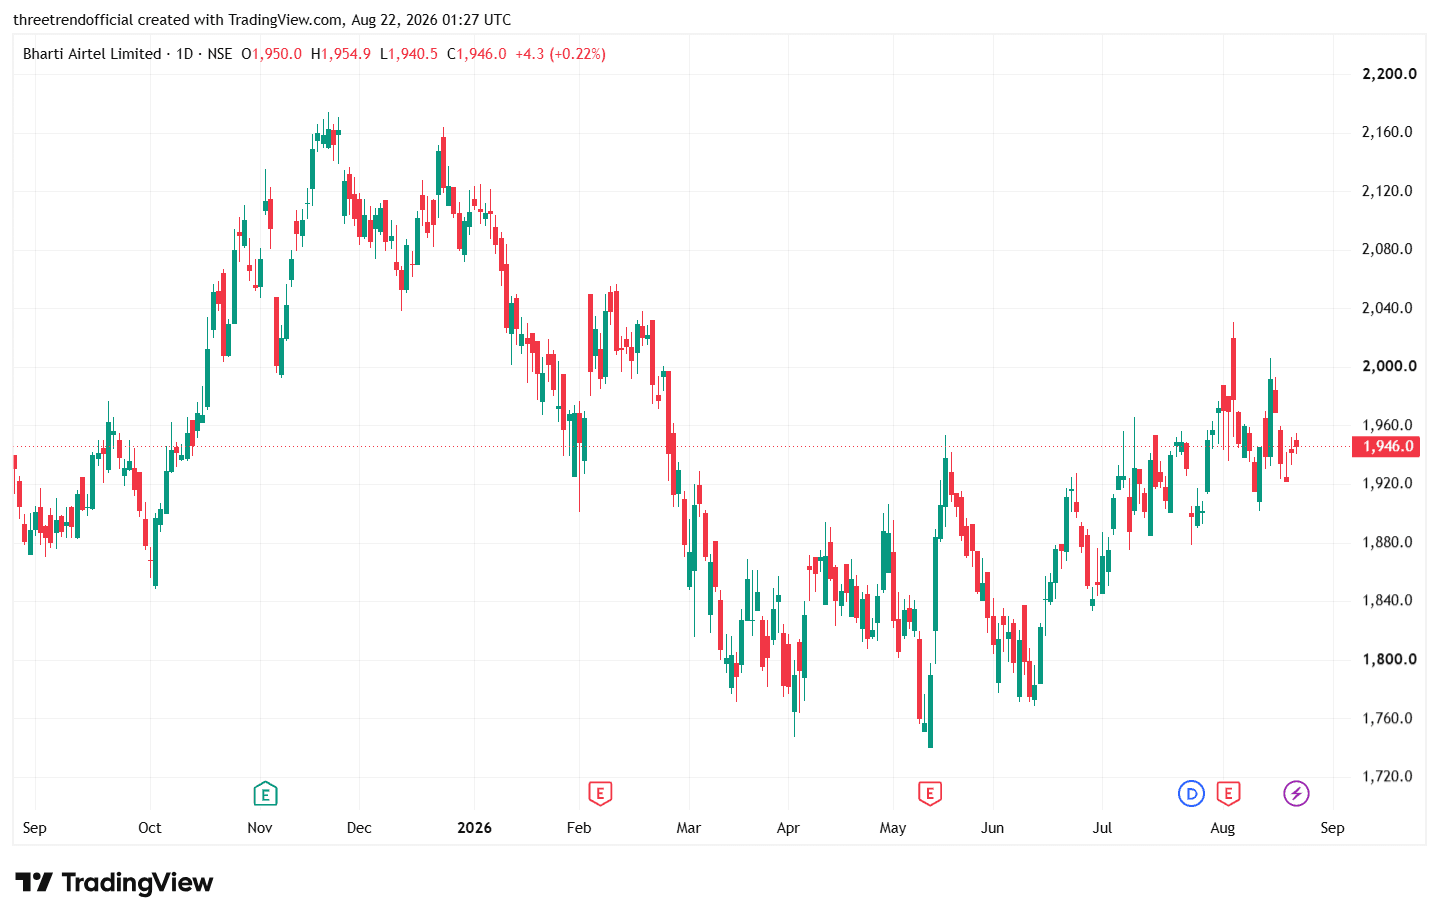
As per the daily chart, Bharti Airtel is currently trading around ₹1,946 and has shown a strong recovery from the ₹1,750–₹1,780 zone formed during May–June. The chart indicates a sequence of higher lows, suggesting that the medium-term recovery structure remains positive. However, after approaching the ₹2,000–₹2,030 resistance zone, the stock has entered a consolidation phase.
Immediate support: ₹1,920–₹1,900
Major support: ₹1,850–₹1,800
Immediate resistance: ₹1,980–₹2,000
Major breakout zone: ₹2,020–₹2,030
A decisive daily close above ₹2,000–₹2,030 with strong volume can indicate a fresh breakout and potentially resume the upward move toward the previous high zone around ₹2,100–₹2,170. On the downside, sustaining above ₹1,900–₹1,920 is important for maintaining the current higher-low structure. A decisive breakdown below ₹1,900 could lead to profit booking toward ₹1,850–₹1,800.
🏢 Fundamental Analysis
Fundamentally, Airtel's recent performance remains strong. In Q1 FY27, consolidated revenue increased 18.4% YoY to ₹58,539 crore, while EBITDA rose to ₹33,599 crore, with the EBITDA margin improving to 57.4%. Net income before exceptional items increased to ₹8,057 crore from ₹5,948 crore in Q1 FY26. Importantly, net debt-to-EBITDA improved significantly to 1.17x from 1.70x, indicating strengthening balance-sheet quality.
The India business is also showing healthy operating momentum. Mobile revenue grew 9.2% YoY, while mobile ARPU increased to ₹264 from ₹250. Smartphone data customers increased by 21.1 million YoY to 301.8 million, and mobile data consumption increased 36% YoY. The Homes business grew revenue by 33.2%, while Airtel Business revenue increased 12%.
#TechnicalViews