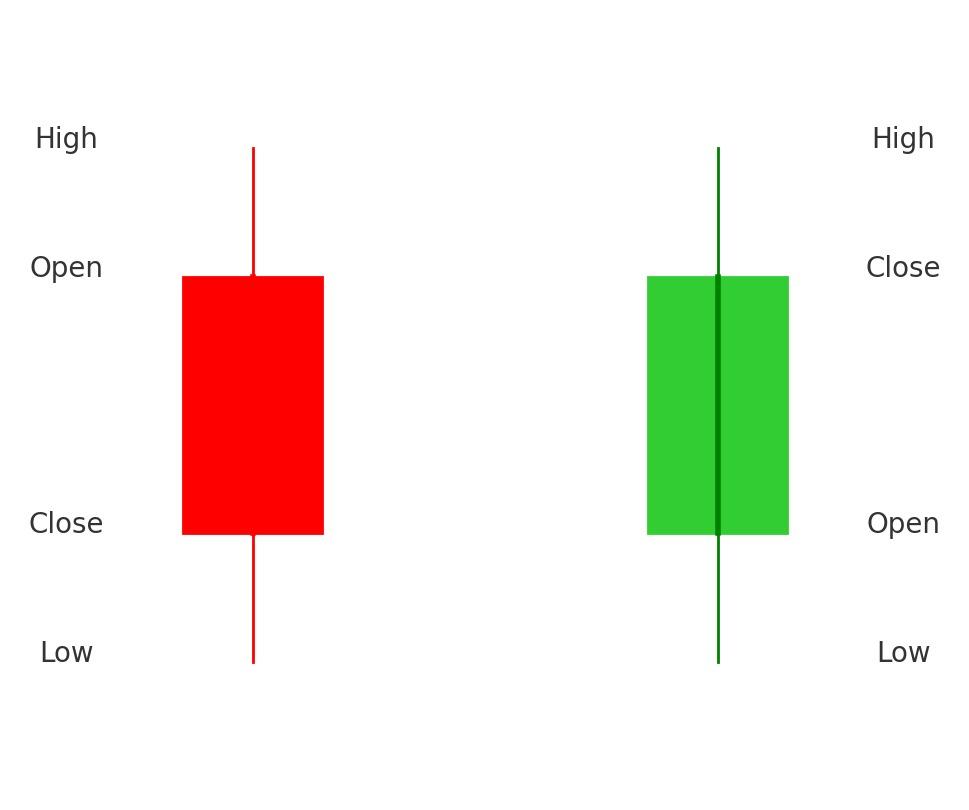
Candlestick analogy
In a candlestick pattern, the open and close represent the first and last traded prices of the selected time frame, while the high and low show the extreme prices reached. If the candlestick is red (bearish), it means the closing price is lower than the opening price—so the top of the body marks the open, and the bottom of the body marks the close. If the candlestick is green (bullish), it means the closing price is higher than the opening price—so the bottom of the body marks the open, and the top of the body marks the close. The upper wick (shadow) indicates the highest price traded, and the lower wick (shadow) shows the lowest price traded during that time period. Together, these four points (Open, High, Low, Close—OHLC) give traders a complete picture of market sentiment within that candle.