


double top
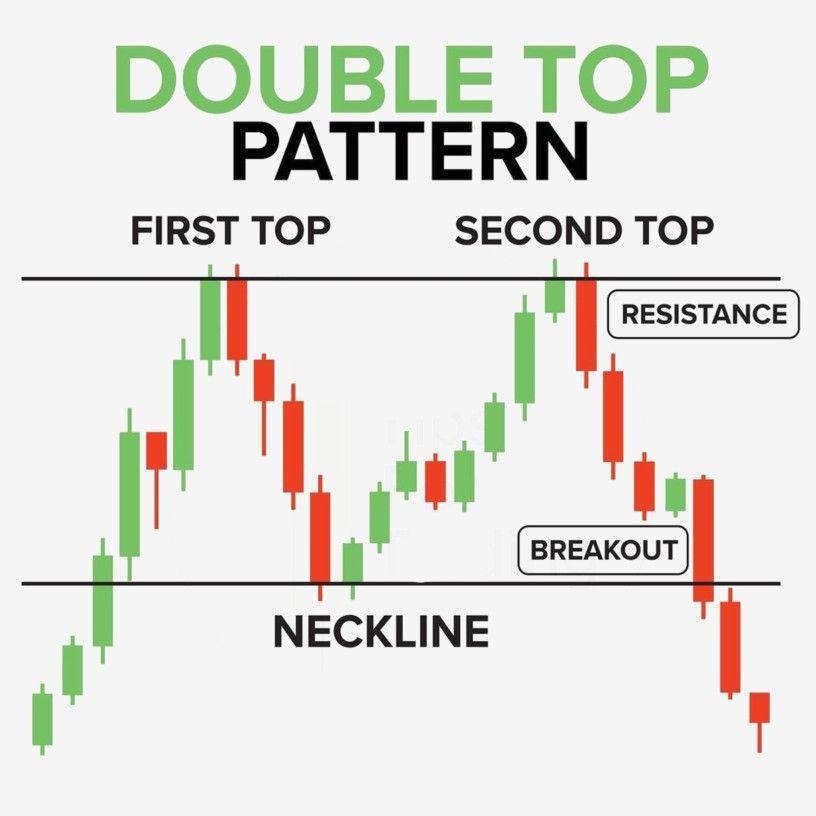
A double top is a bearish reversal chart pattern that forms after an uptrend and resembles the letter “M.” It occurs when the price reaches the same resistance level twice but fails to move higher, indicating that buying momentum is weakening and sellers are gaining control. The pattern is confirmed when the price breaks below the neckline (the support formed between the two peaks) with strong trading volume, signaling a potential trend reversal to the downside. Traders often wait for a confirmed breakdown and a retest of the neckline, which then acts as resistance, before entering short positions to reduce the risk of false breakdowns. POWERGRID
#Today’sTradingSetup#StockInNews#WatchOutFor#IndexStrategies#PersonalFinance
883 likes·47 comments