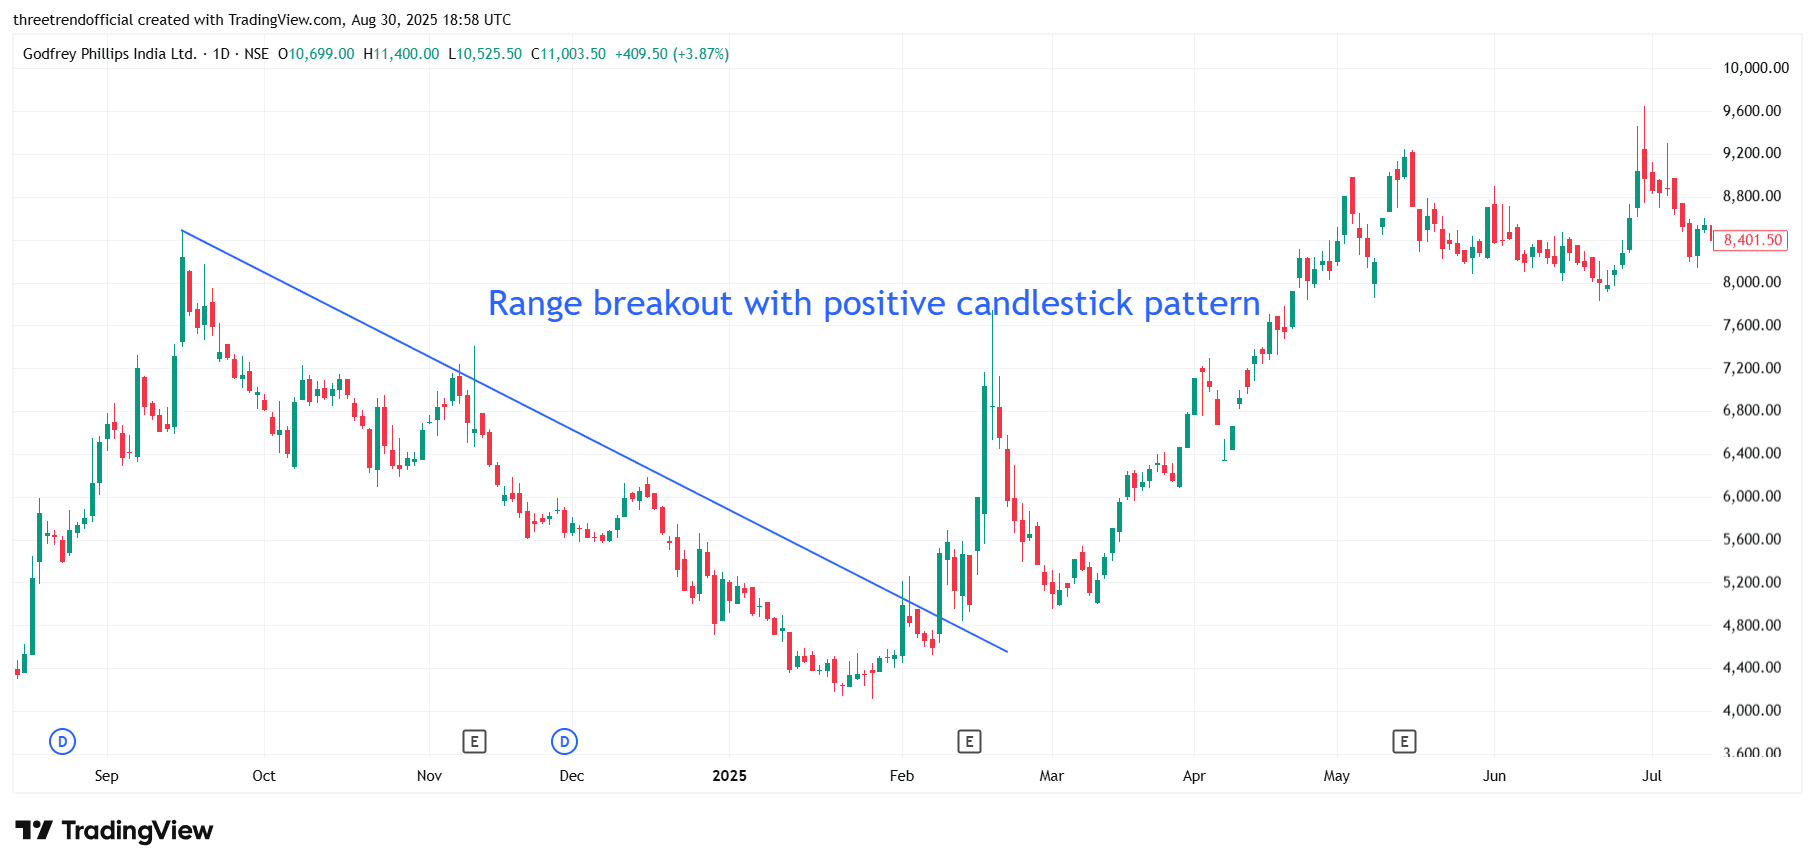
GODFRYPHLP This chart of Godfrey Phillips India Ltd (NSE) demonstrates the range breakout with positive candlestick confirmation concept. The stock was in a prolonged downtrend, moving within a descending range defined by the trendline. Eventually, a strong bullish candlestick pattern appeared near the lower levels, followed by a decisive breakout above the falling trendline. This breakout indicated that sellers had lost momentum and buyers took charge, leading to a sustained rally. Such setups highlight how combining trendline breakout with positive candlestick patterns improves reliability, giving early entry signals for capturing large upside moves.
#FundamentalViews#TechnicalViews