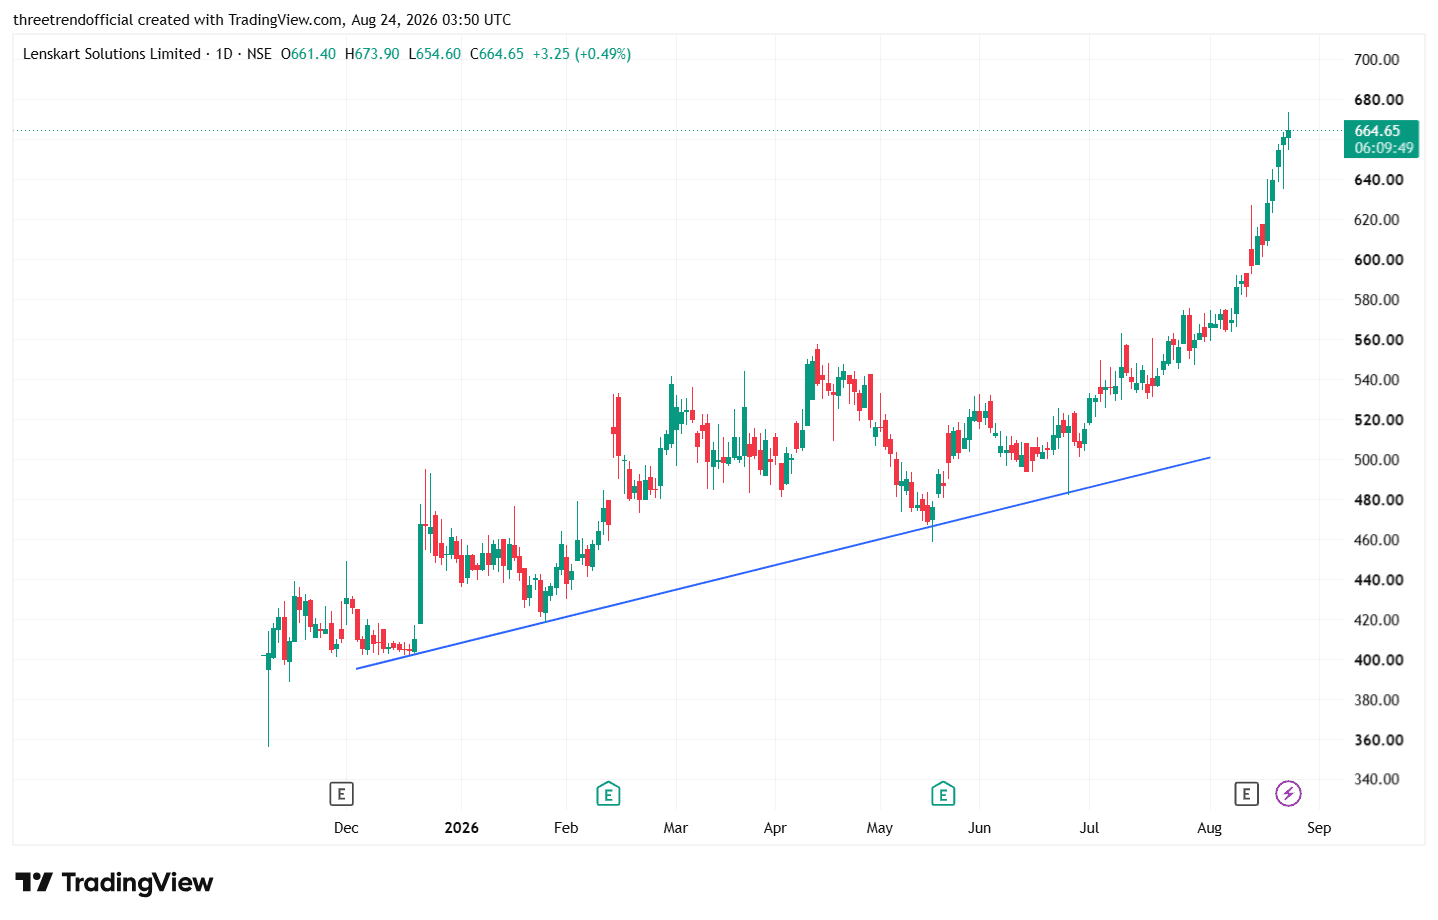
The Higher Low + Trendline Support Zone concept is a strong indication of an uptrend or bullish structure in technical analysis.
Higher Low (HL): When every significant correction in the stock stops above the previous swing low, it forms a Higher Low. This shows that buyers are entering at progressively higher price levels.
Trendline Support: By connecting these successive higher lows with a trendline, we get a rising support zone. This trendline represents a dynamic area where buying interest may emerge during corrections.
What happens on the chart: Price moves upward, corrects toward the trendline, finds support, and then attempts another upward move. Repeated successful bounces strengthen the importance of the trendline.
Trading interpretation: As long as price continues to respect the rising trendline and keeps forming Higher Lows, the bullish structure remains intact. A decisive breakdown below the trendline and the previous Higher Low can signal weakness or a possible trend reversal.
In simple terms: Higher Highs + Higher Lows + rising trendline support = healthy bullish structure.