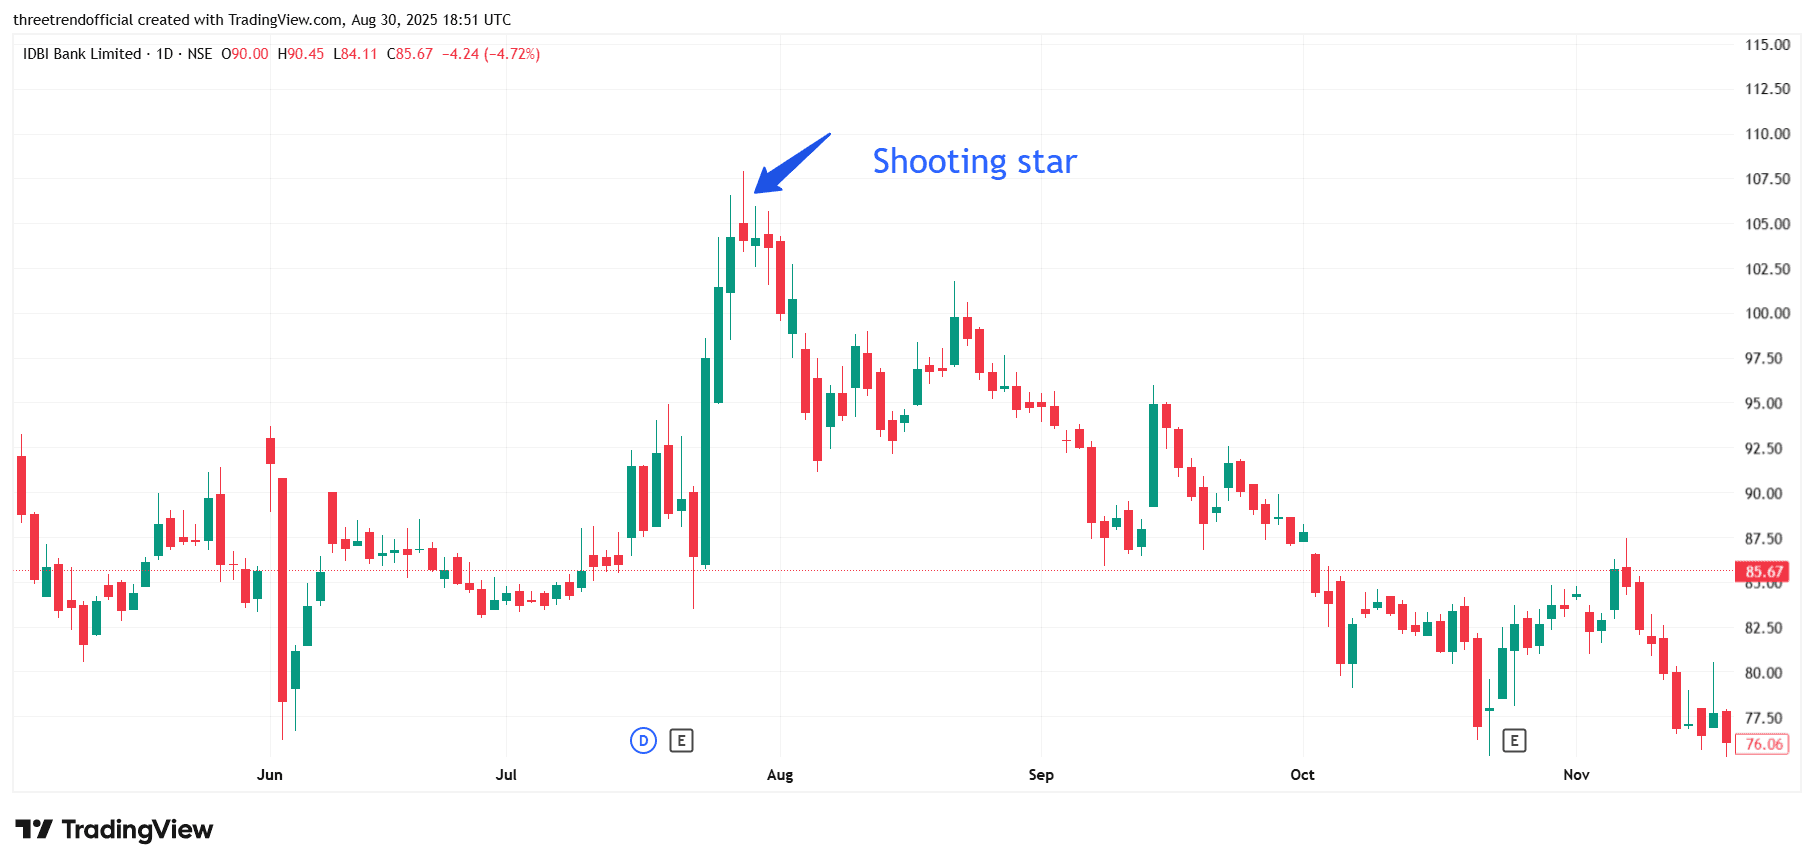
IDBI This chart of IDBI Bank Ltd (NSE) shows the formation of a shooting star candlestick pattern after a strong uptrend, signaling exhaustion of buying momentum and potential reversal. The long upper wick reflects that bulls tried to push prices higher but failed, as sellers regained control and forced a close near the day’s low. This bearish reversal signal worked effectively, as the stock entered a downtrend immediately after, confirming that the shooting star acted as a strong warning of weakness. Such patterns at the top of rallies are reliable for identifying profit-booking zones and shorting opportunities.
#TechnicalViews#FundamentalViews