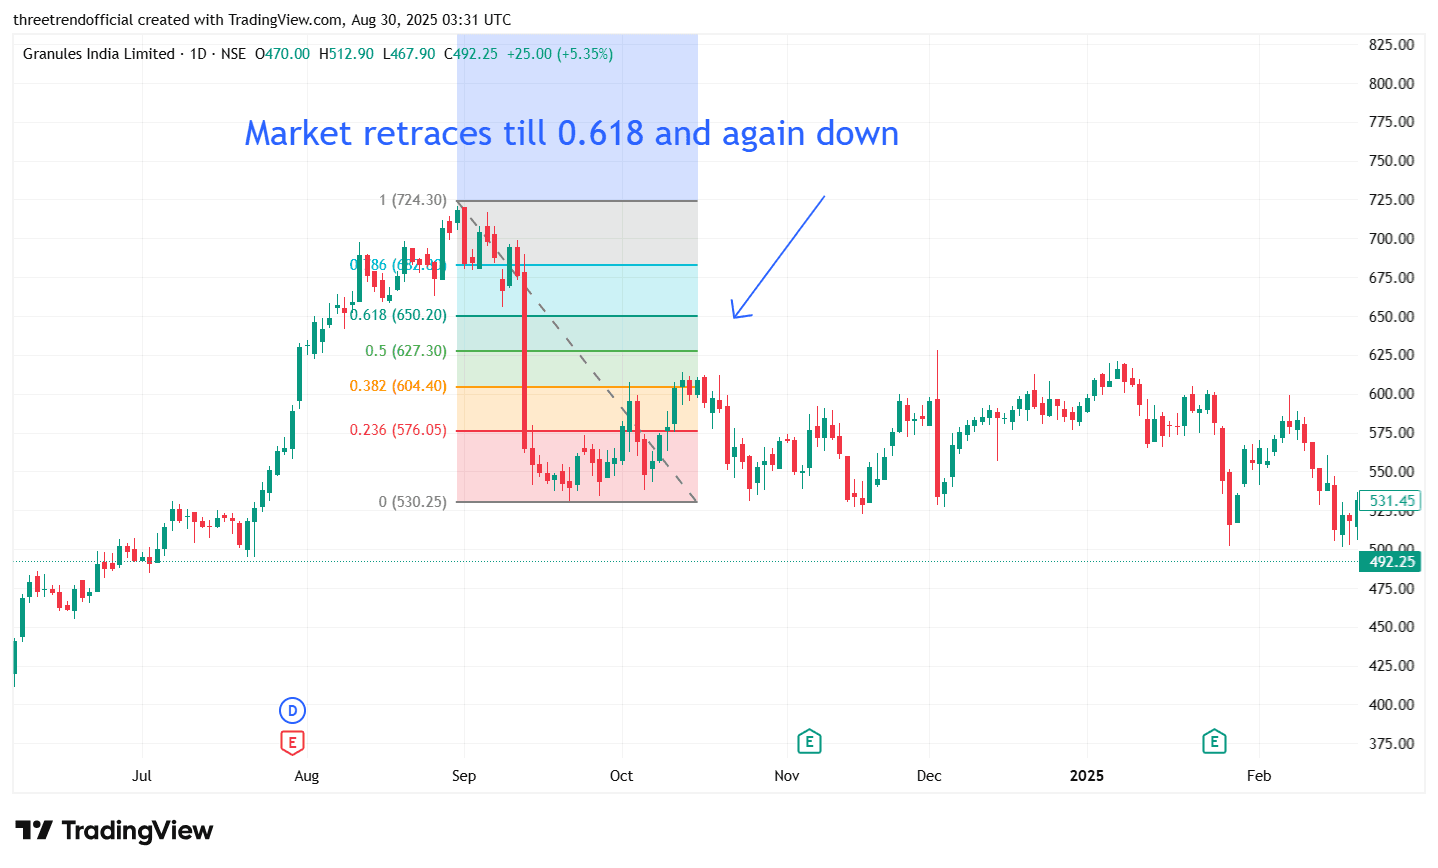
In a downtrend, Fibonacci retracement is used to identify possible pullback levels where the price might pause or reverse before continuing lower. After a fall from a swing high to a swing low, traders plot the Fibonacci retracement tool from the top (high) to the bottom (low). The key retracement levels—23.6%, 38.2%, 50%, and 61.8%—act as resistance zones during a correction. In the chart of Granules India, the stock dropped sharply and then retraced upward till the 61.8% level (650 zone), which is a strong resistance in downtrends. Once price failed to sustain above this level, sellers regained control and pushed the market down again. The concept helps traders identify entry points for short positions in a bearish trend and manage stop-loss levels effectively.