


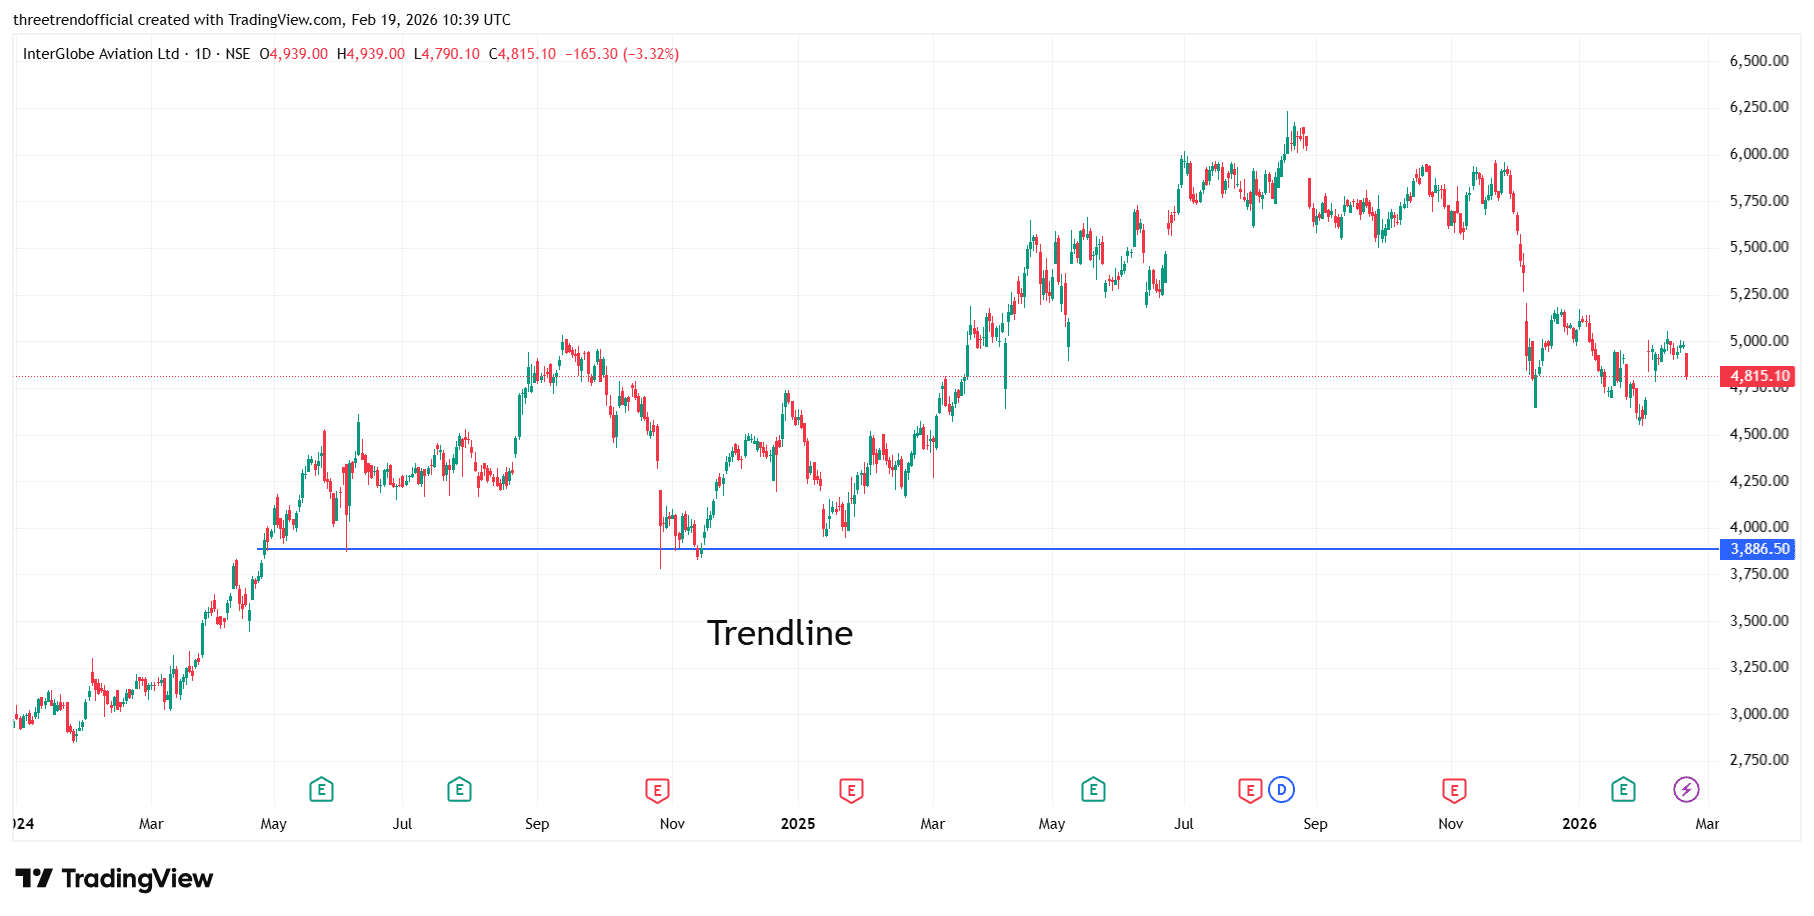
INDIGO A horizontal trendline is drawn by connecting multiple price points at the same level, showing a strong support or resistance zone where price repeatedly reacts. When price fails to move above a horizontal line, it acts as resistance, indicating selling pressure at that level; when price holds above it, the line works as support, showing buying interest. The more times price touches and respects a horizontal trendline, the stronger it becomes, and a clear breakout or breakdown from this level often signals a potential trend continuation or reversal.
#TechnicalViews#FundamentalViews
1,015 likes·27 comments