


infosys
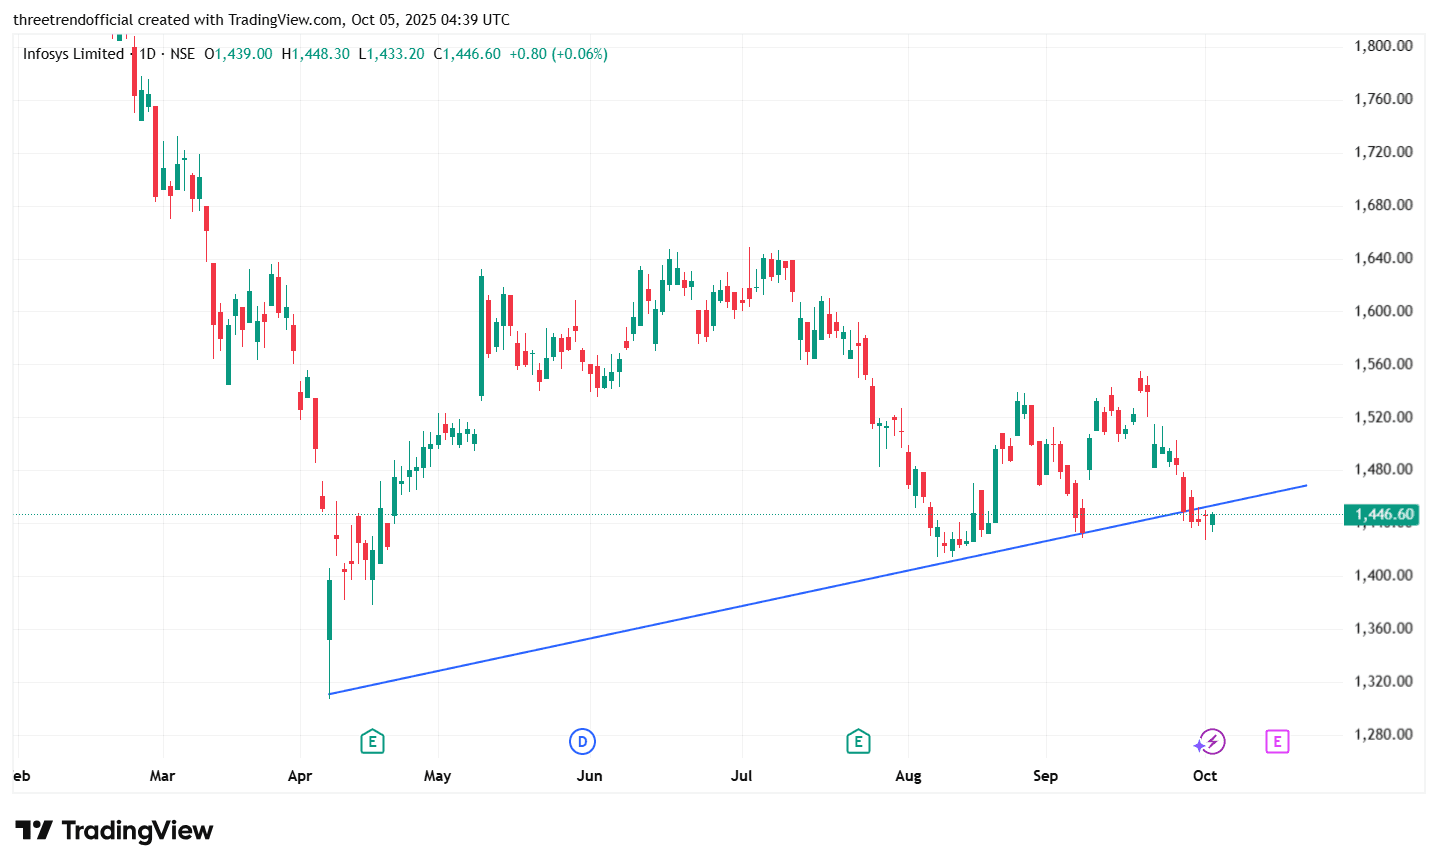
In the chart of Infosys Limited, the stock is currently trading near the ascending trendline support, indicating that it is at a critical breakdown level. The blue trendline, drawn by connecting the recent higher lows, has so far acted as a strong support zone. However, the recent candles show price testing this line from below, suggesting weakness in bullish momentum. If the stock closes decisively below this trendline, it would confirm a trendline breakdown, potentially leading to further downside towards the next support area near ₹1,400–₹1,380. Conversely, a rebound from this level could trigger a short-term pullback if buyers defend the trendline.
INFY
#FundamentalViews#TechnicalViews
570 likes·75 comments