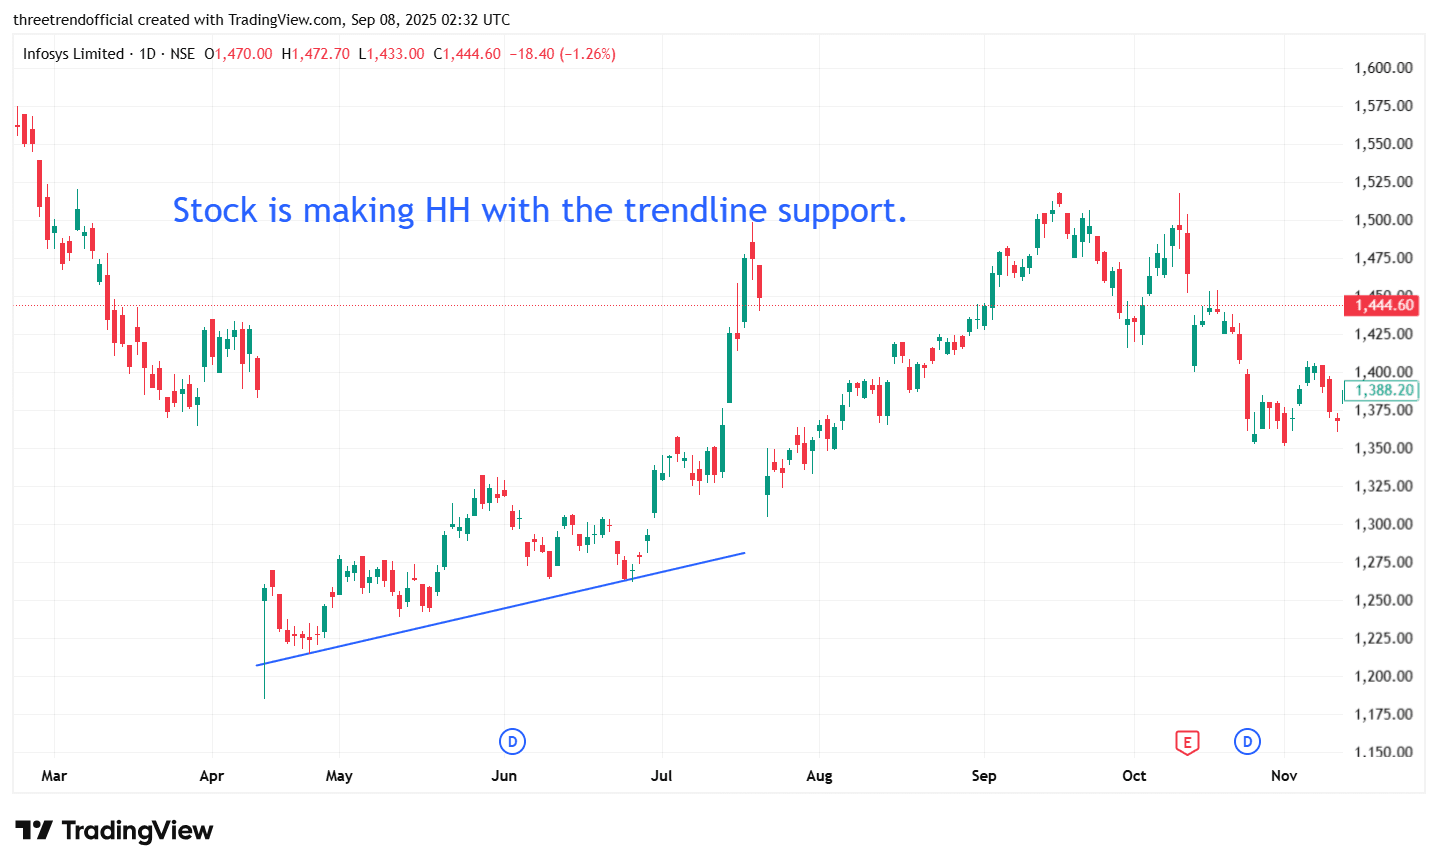
The chart shows that the stock is making Higher Highs (HH) while respecting a trendline support zone, which is a classic sign of an ongoing uptrend. A Higher High occurs when each successive peak in price is above the previous one, reflecting strong buying momentum. The trendline drawn under the swing lows acts as a dynamic support, where buyers consistently step in to defend the price and push it higher. This combination of rising highs with a stable support line signals that the bulls are in control, and as long as the price respects this trendline, the probability of continuation in the upward move remains high. Traders often use such setups to identify pullback buying opportunities near the support zone with confirmation of bullish candles or volume.