


MGL
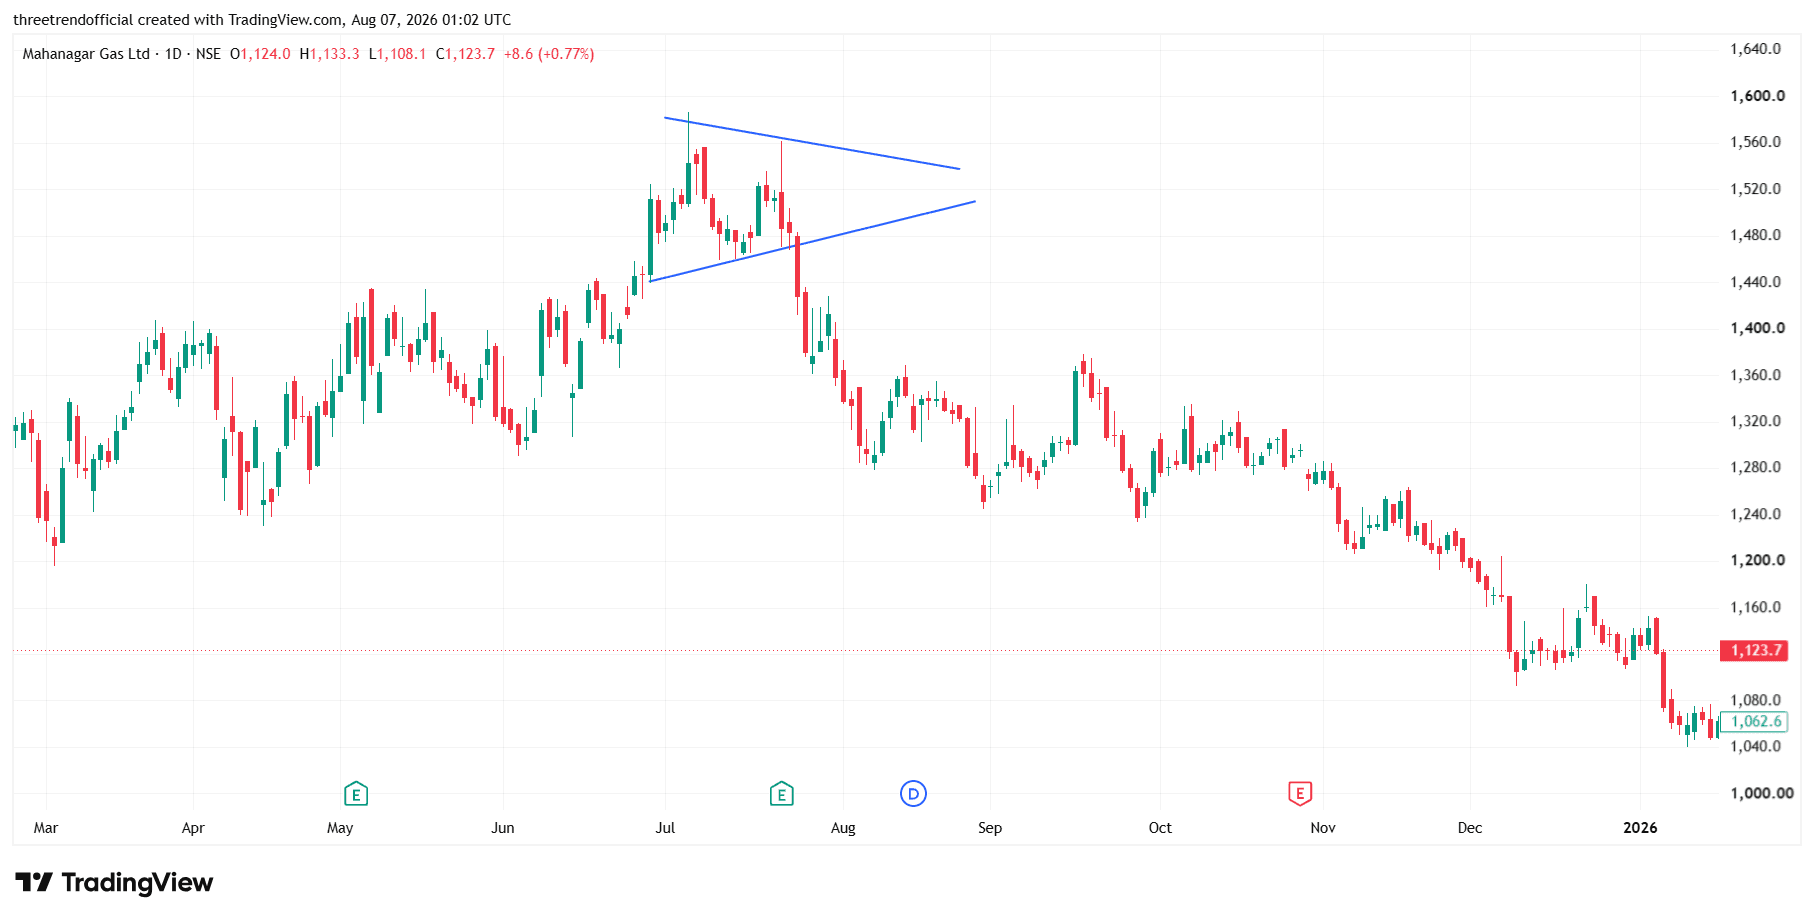
$MGL The chart shows a symmetrical triangle breakdown, where the price was consolidating between a series of lower highs and higher lows before decisively breaking below the lower trendline. This breakdown signals that sellers have gained control, often leading to a sharp increase in bearish momentum as trapped buyers exit their positions and fresh short-selling emerges. In this example, the stock failed to hold the triangle support, resulting in a strong downward move and the continuation of the prevailing downtrend. Traders typically view such a breakdown as a bearish signal and wait for a retest of the broken support, which may act as a new resistance, before considering fresh short positions.
#TechnicalViews#FundamentalViews
1,111 likes·75 comments