


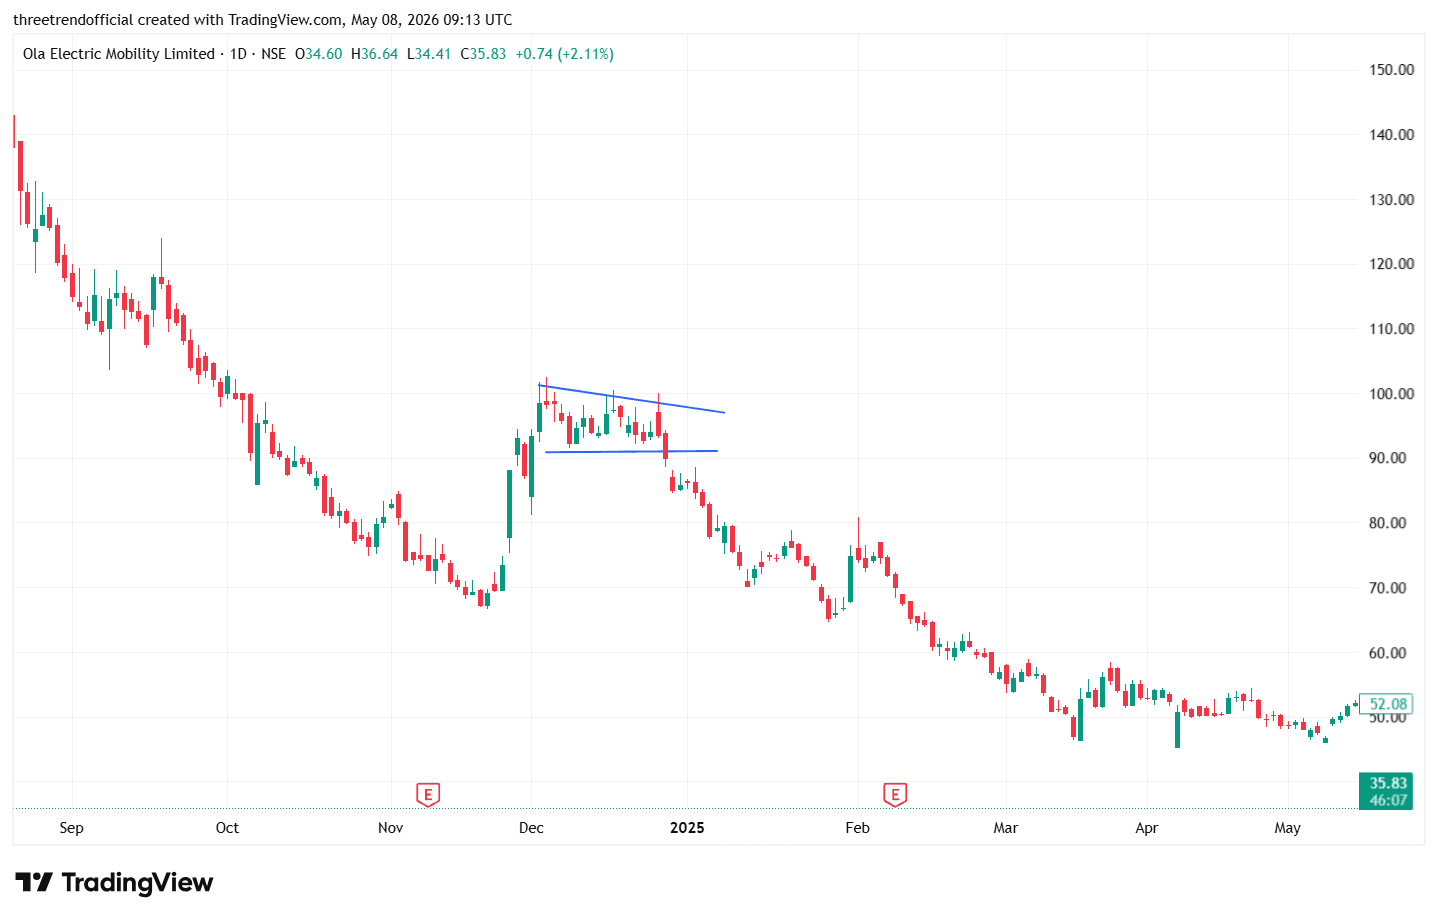
OLAELEC A descending triangle is a bearish chart pattern formed when price makes lower highs while taking support at a horizontal support zone, creating a triangle shape on the chart. This pattern indicates that sellers are becoming more aggressive, as every bounce is weaker than the previous one. When the price finally breaks below the support level with strong volume, it signals a potential downside breakout and continuation of the bearish trend. Traders often watch for confirmation through a strong bearish candlestick and increased selling pressure after the breakdown.
#TechnicalViews#FundamentalViews
825 likes·88 comments