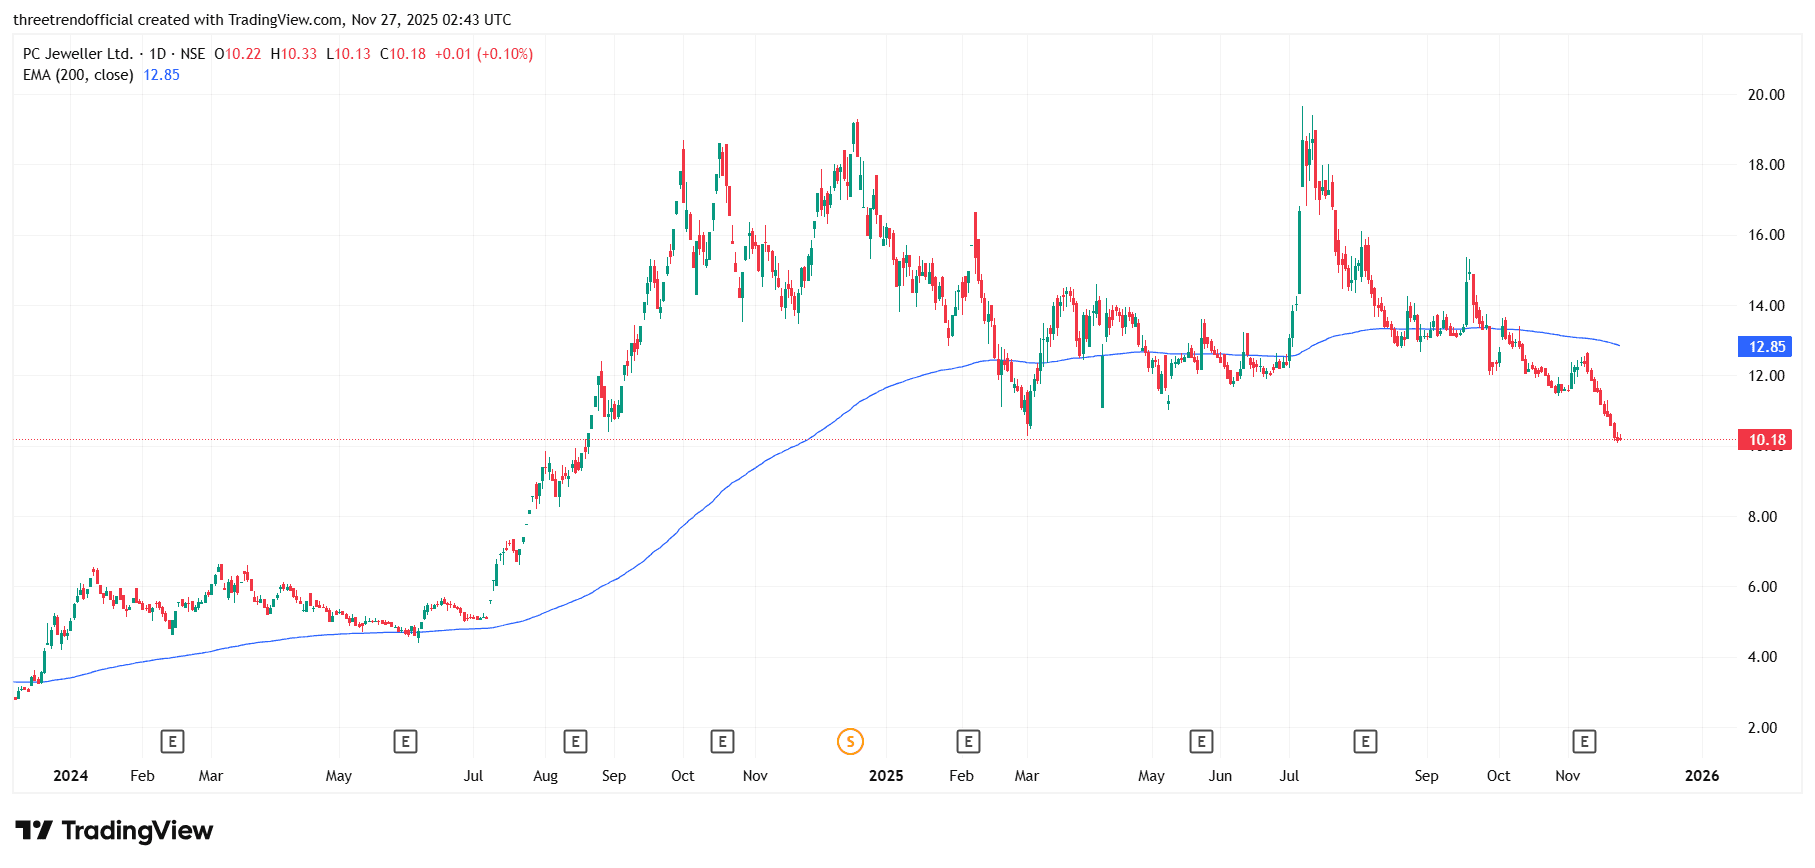
The current daily chart of PC Jeweller clearly reflects a strong and consistent downtrend with price forming continuous lower highs and lower lows. Recent candles show aggressive selling pressure, indicating that buyers are not defending any key levels. The breakdown near the 10.20 zone shows that the stock has lost previous support and is sliding further without any strong bullish reaction. Volume behaviour and candle structures suggest that sellers are fully in control of the trend. The broader price movement shows no sign of consolidation or reversal yet. Each pullback is getting sold into, which confirms a weak sentiment. Until the price forms a clear reversal pattern or closes above a previous swing high, the trend is likely to remain bearish. The overall structure warns traders to stay cautious and avoid premature bottom-picking. A sustainable recovery will require strong bullish candles with follow-through.
The 200 EMA is one of the most widely respected long-term trend indicators used in technical analysis. It represents the average price of the last 200 periods and helps identify the overall direction of the market. When the price trades above the 200 EMA, it indicates long-term strength and investor confidence, while trading below it suggests long-term weakness. The 200 EMA acts as a dynamic support or resistance level, depending on the price position. Institutions and large players often use this level to determine buying or selling zones. When the price consistently stays below the 200 EMA, rallies tend to fail and sellers dominate the market. Similarly, when the price remains above it, corrections usually find support near the EMA. In this chart, the price falling far below the 200 EMA highlights strong bearish momentum and signals that recovery may take time. Traders often avoid long positions until the price closes back above this key level with strength.