


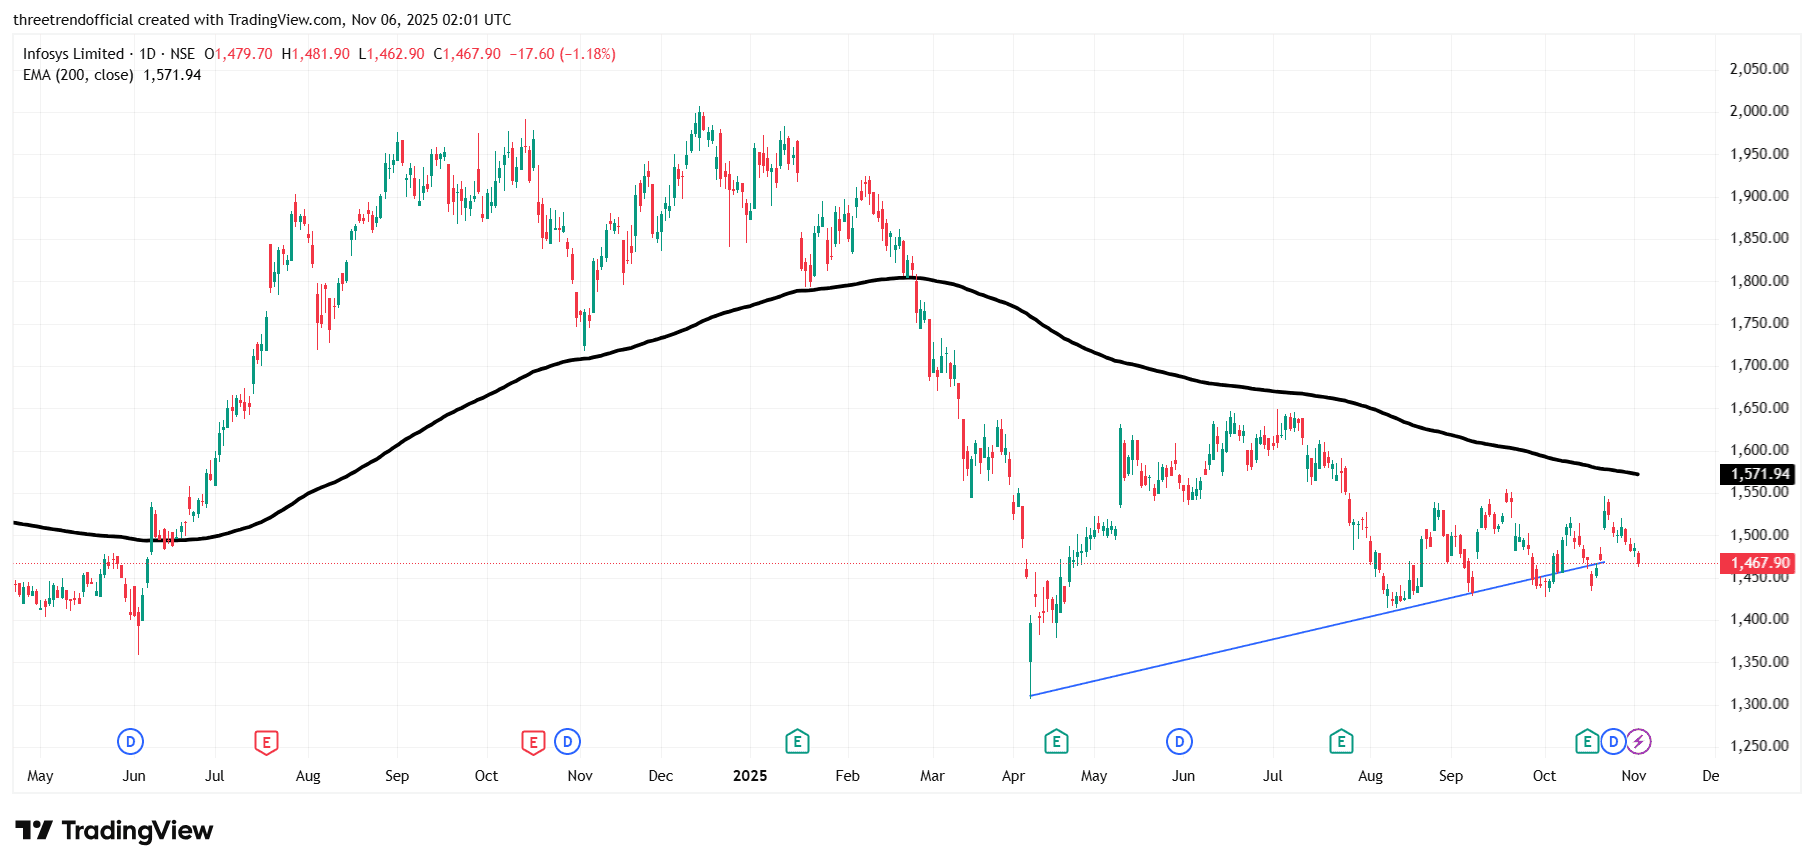
Prices below 200 ema
When prices move below the 200 EMA (Exponential Moving Average), it generally signals a long-term bearish trend or weakness in the stock. The 200 EMA acts as a major dynamic resistance, meaning that as long as the price stays below it, sellers dominate and buying strength remains limited. Traders and investors often view this zone as a no-trade or short-selling region, waiting for either a pullback toward the 200 EMA for a better short entry or a decisive breakout above it to confirm a trend reversal. In essence, staying below the 200 EMA reflects that the stock is under long-term distribution pressure, and any rally may face resistance near that line.
INFY
#FundamentalViews#TechnicalViews
748 likes·37 comments