


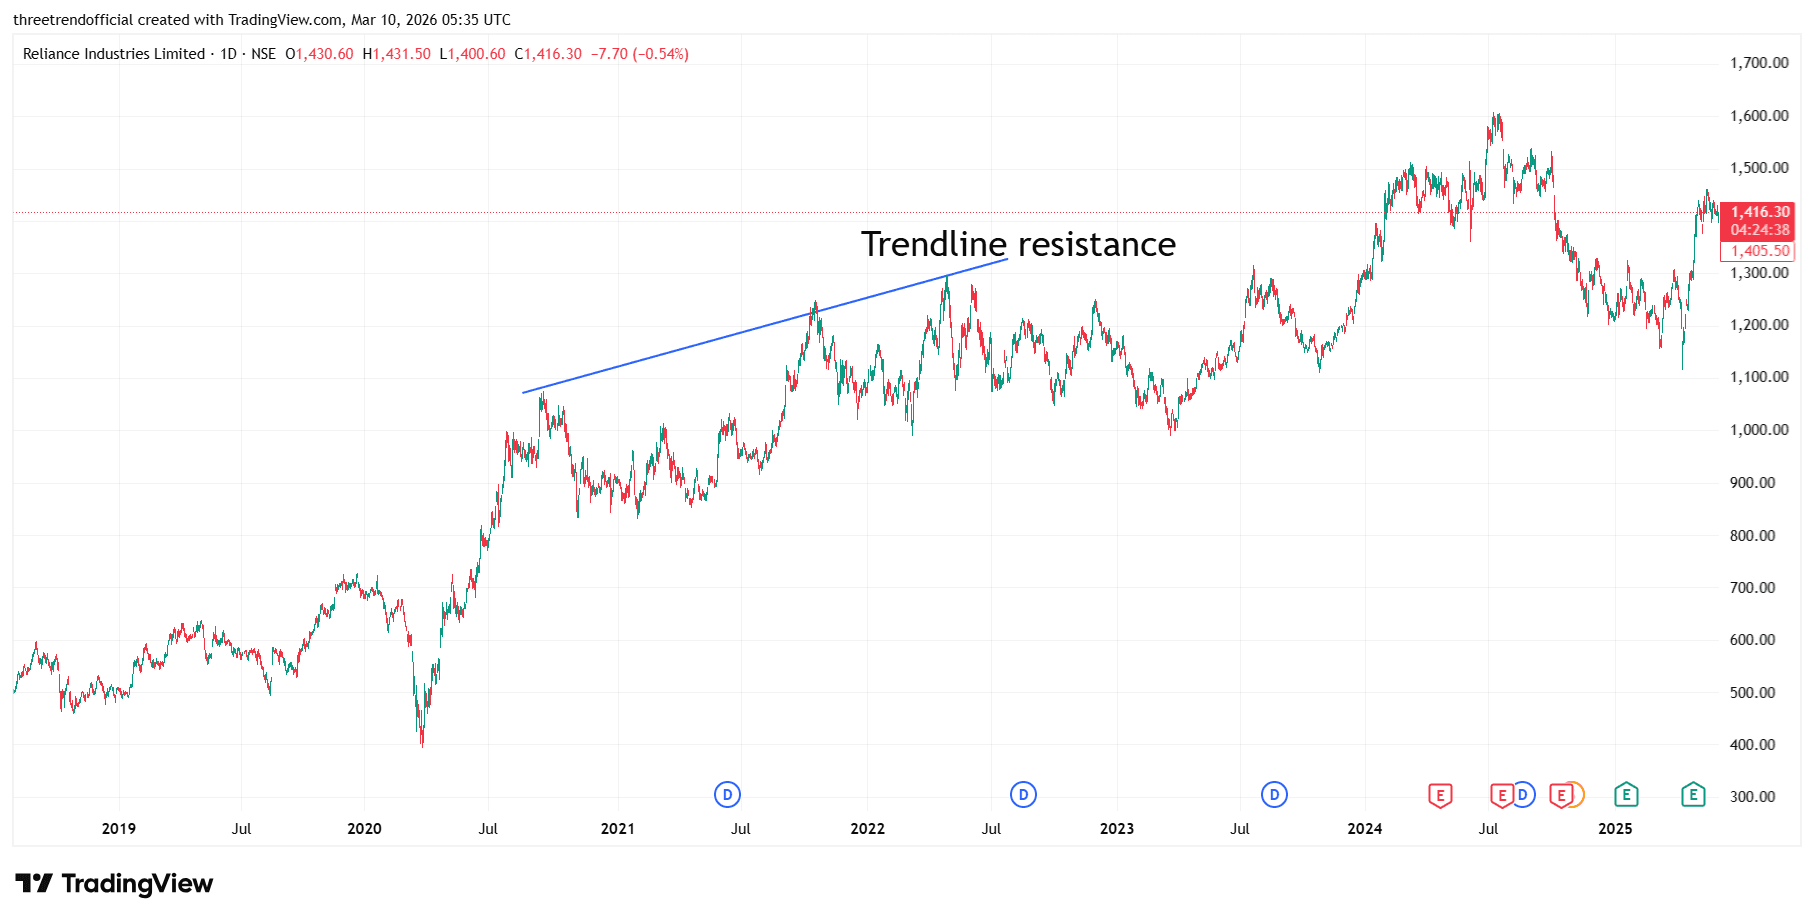
RIIL A trendline resistance is formed by connecting two or more lower highs in a downtrend, creating a downward sloping line on the price chart. This line acts as a resistance level where the stock price often faces selling pressure when it approaches the trendline. Traders use this line to identify potential reversal zones, as the price may struggle to move above it unless strong buying momentum appears. If the price successfully breaks above the trendline resistance with strong volume, it may indicate a possible trend reversal or the beginning of a bullish move.
#TechnicalViews#FundamentalViews
494 likes