


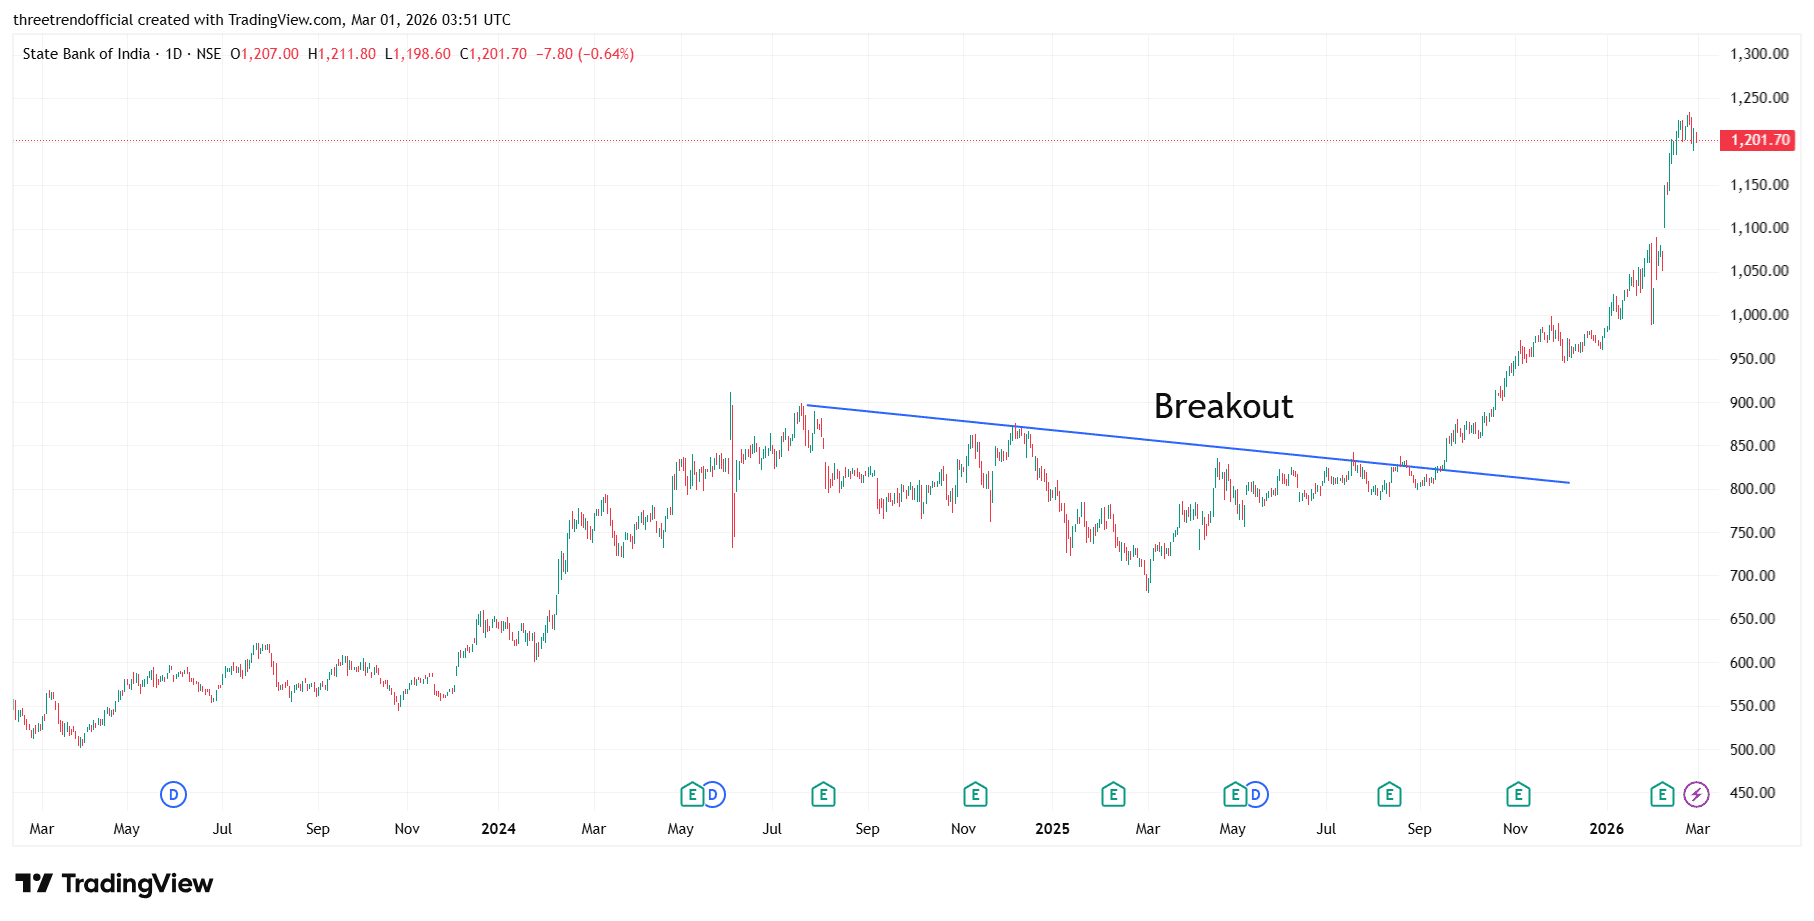
SBIN Suppose a stock is making lower highs and you draw a downward sloping trendline connecting those highs. This trendline acts as a resistance, meaning price keeps falling after touching it. After several attempts, one day the stock closes strongly above the trendline with high volume. This is called a trendline breakout, which indicates that sellers are losing control and buyers are becoming stronger. Often, price may come back to retest the broken trendline (now acting as support) and then continue moving upward, confirming a potential trend reversal from bearish to bullish.
#TechnicalViews#FundamentalViews
530 likes·65 comments