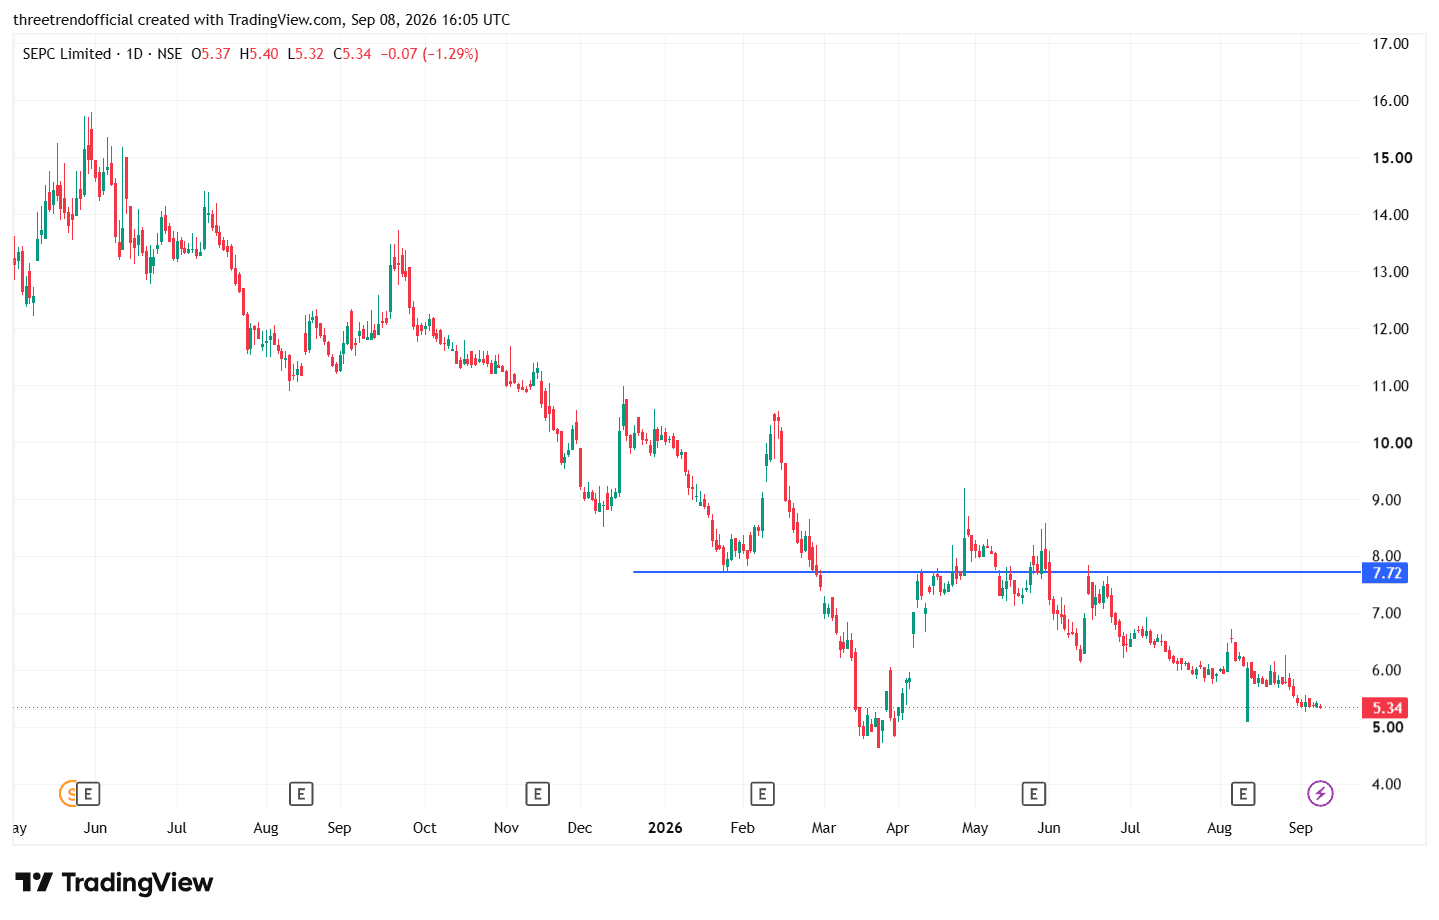
SEPC – Technical + Fundamental Analysis with chart
SEPC
Technical Analysis
On the daily chart, SEPC is still in a broader downtrend, with a clear sequence of lower highs and lower lows. The stock is currently around ₹5.34, after falling from the ₹7.5–₹8 zone.
₹5.00–₹5.20 → immediate support/demand zone; recent price action is holding around this area.
₹4.80–₹5.00 → deeper support if ₹5 breaks decisively.
₹7.70–₹7.80 → major resistance, clearly marked by the horizontal trendline on your chart.
A sustained move above ₹7.70–₹7.80 with strong volume would be the first major indication of a trend reversal.
Above ₹7.80, the stock could potentially move toward ₹8.50–₹9.00, followed by ₹10, subject to momentum.
If ₹5 breaks with strong selling volume, the stock can remain weak and retest lower support levels.
Technically, the important point is that ₹7.72 is still resistance, not support. Until the stock reclaims this level, the chart remains structurally weak.
Fundamental Analysis
Fundamentally, SEPC has an interesting order-book-driven growth story, but profitability and execution remain major concerns. Q1 FY27 revenue increased about 40% YoY to ₹282 crore, while the company had ₹10,670 crore of orders on hand as of June 30, 2026. The order book was almost evenly split between domestic ₹5,270 crore and international ₹5,400 crore projects.
A major positive is the company's recent SAIL-related order momentum. SEPC won multiple packages at SAIL's IISCO Burnpur plant, including a ₹952 crore pellet-plant BOP order, in addition to earlier sinter and coke-oven packages. This strengthens revenue visibility and increases exposure to the metals and mining EPC segment.