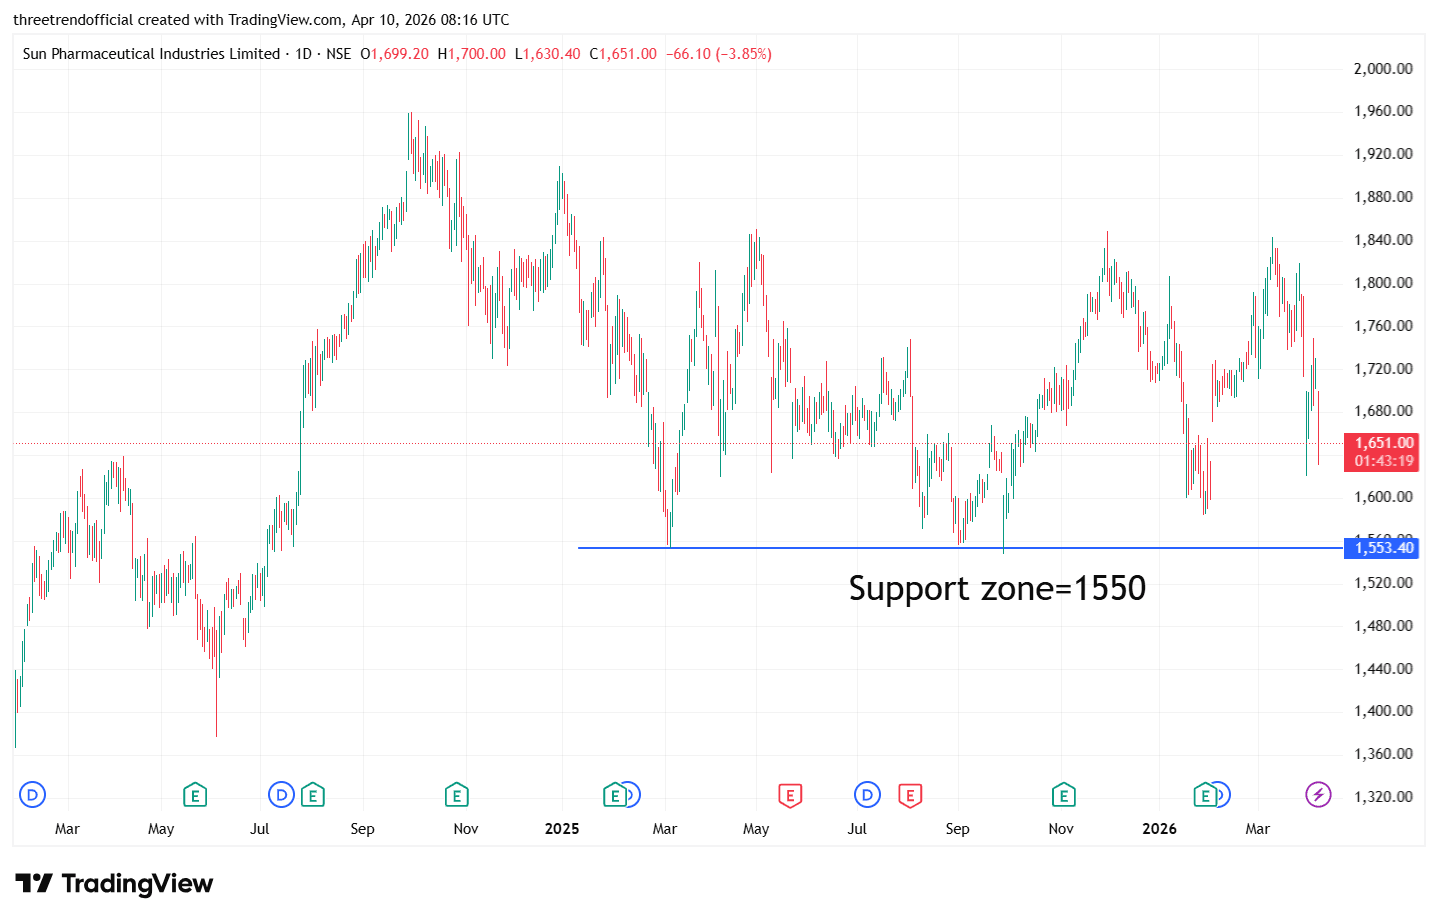
The stock is moving in a broad sideways range where the horizontal trendline around 1550 is acting as a strong demand zone, as price has taken support multiple times from this level indicating buyer interest; currently, the price is again reacting downward from the mid-range, suggesting continued consolidation unless a clear breakout or breakdown happens. In technical analysis, a horizontal trendline is drawn by connecting multiple swing lows (support) or swing highs (resistance) at the same price level, showing areas where demand or supply consistently enters the market; the more times price respects this level, the stronger it becomes, and a decisive break below support (1550) can trigger further downside, while holding above it keeps the range-bound structure intact.