


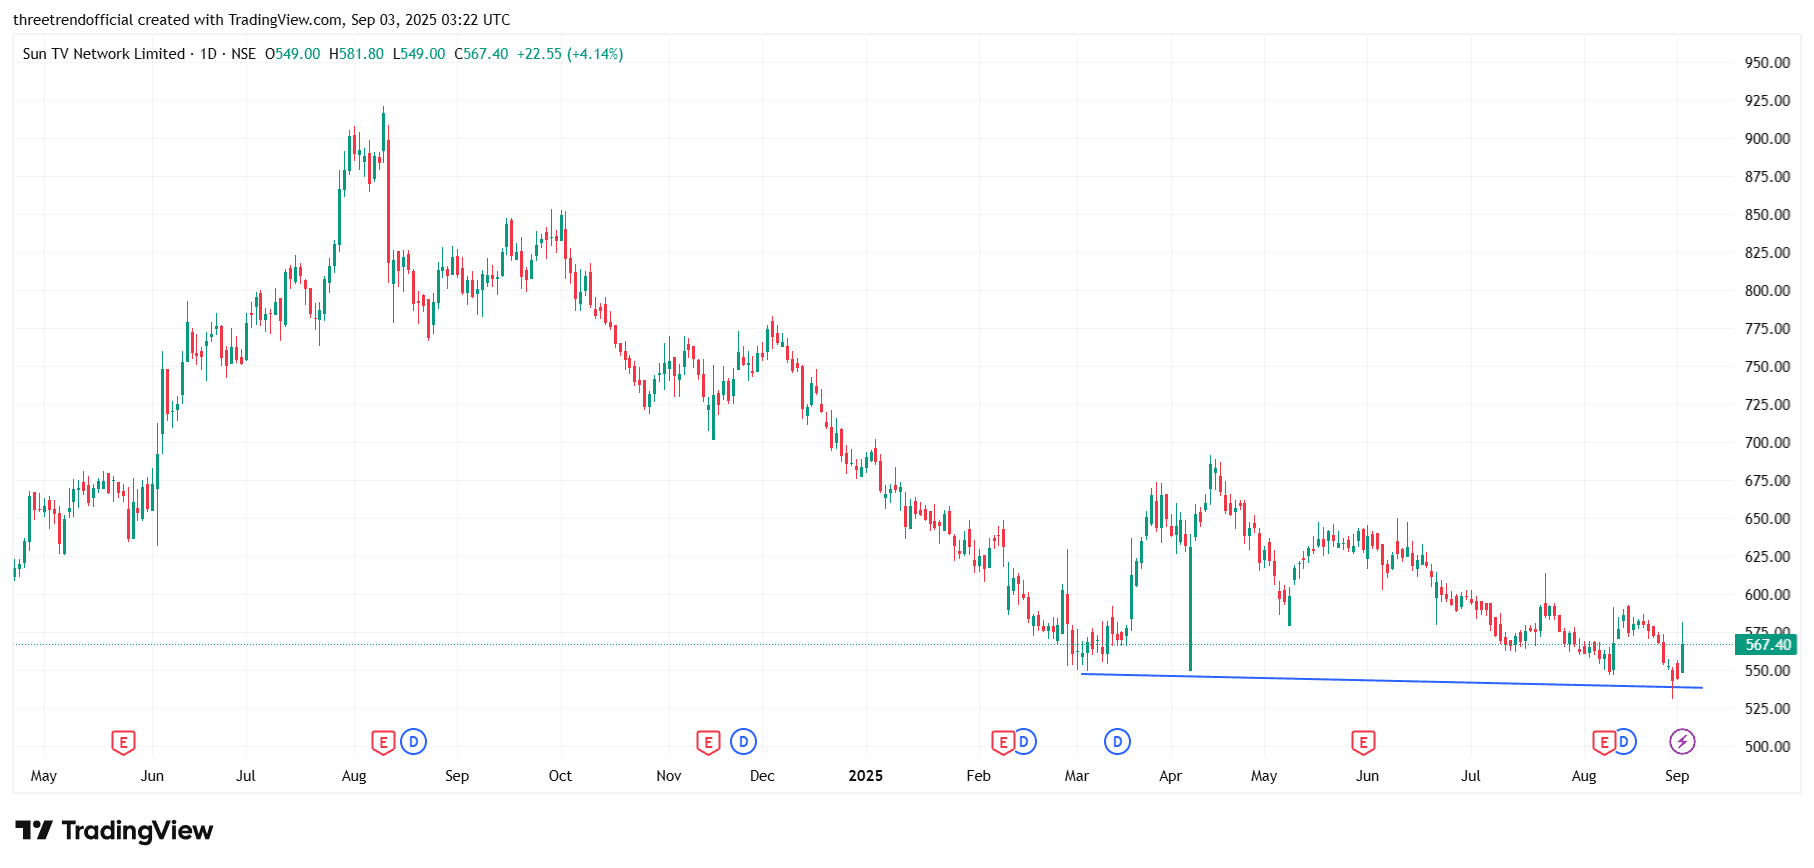
SUNTV The chart of Sun TV Network Limited (NSE) shows a clear downtrend from the 900+ levels to a recent low near 530, with the stock consistently making lower highs and lower lows. Currently, it is hovering around its long-term horizontal support zone near 540–550, as indicated by the drawn trendline, and has bounced sharply with a 4% gain. This bounce from support suggests a possible short-term pullback toward 590–610 levels, but the broader trend remains weak unless it sustains above 620. On the downside, a decisive breakdown below 540 could trigger further declines toward 500.
#TechnicalViews#FundamentalViews
836 likes·1 comment