


Suzlon
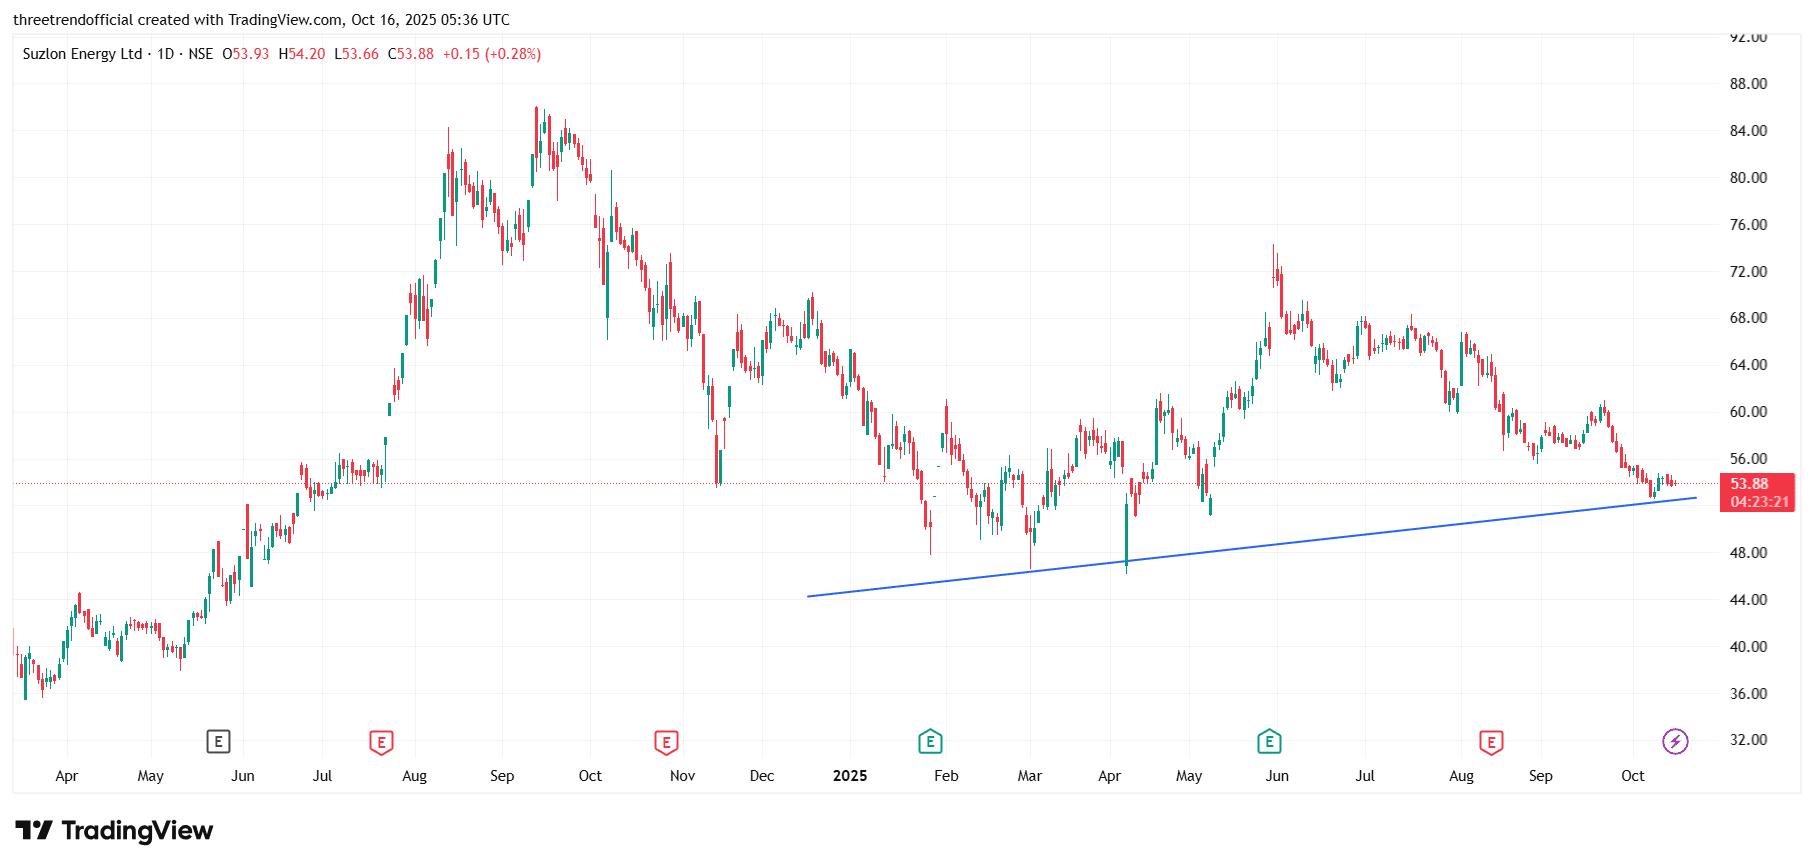
SUZLONIn this Suzlon Energy chart, the blue upward line is a trendline, which connects the series of higher lows (HLs) and acts as a strong support zone, showing that buyers consistently enter near that level to push prices higher. When the price respects this trendline, it indicates the continuation of an uptrend, but if it breaks below, it signals possible weakness or reversal. The formation of higher highs (HHs) along with higher lows confirms bullish strength, as each new high shows buyers are capable of pushing prices above previous peaks. This pattern helps traders identify trend direction, find better entry points near the trendline, and stay aligned with the prevailing momentum.
#FundamentalViews#TechnicalViews
819 likes·68 comments