


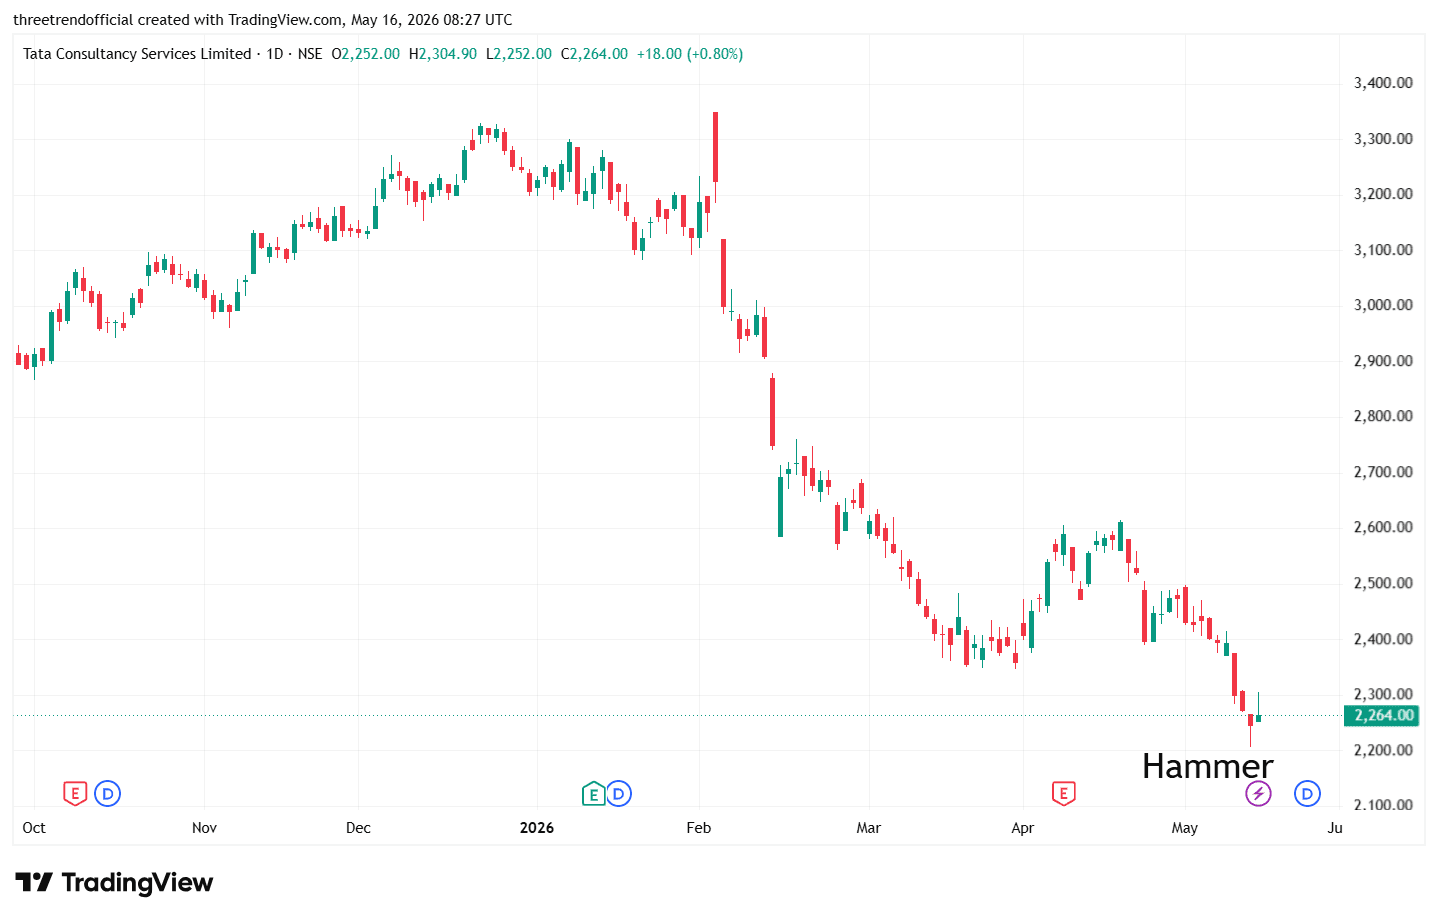
TCS A red hammer candlestick indicates that sellers pushed the price lower during the session, but buyers managed to recover most of the losses before closing. Even though the candle closes below the opening price, the long lower shadow shows strong buying interest at lower levels. When it appears near a support zone or after a downtrend, it can signal a potential bullish reversal, especially if the next candle confirms upward momentum.
#Miscellaneous#SectorBreakouts#IndexStrategies#WatchOutFor#StockInNews
790 likes·49 comments