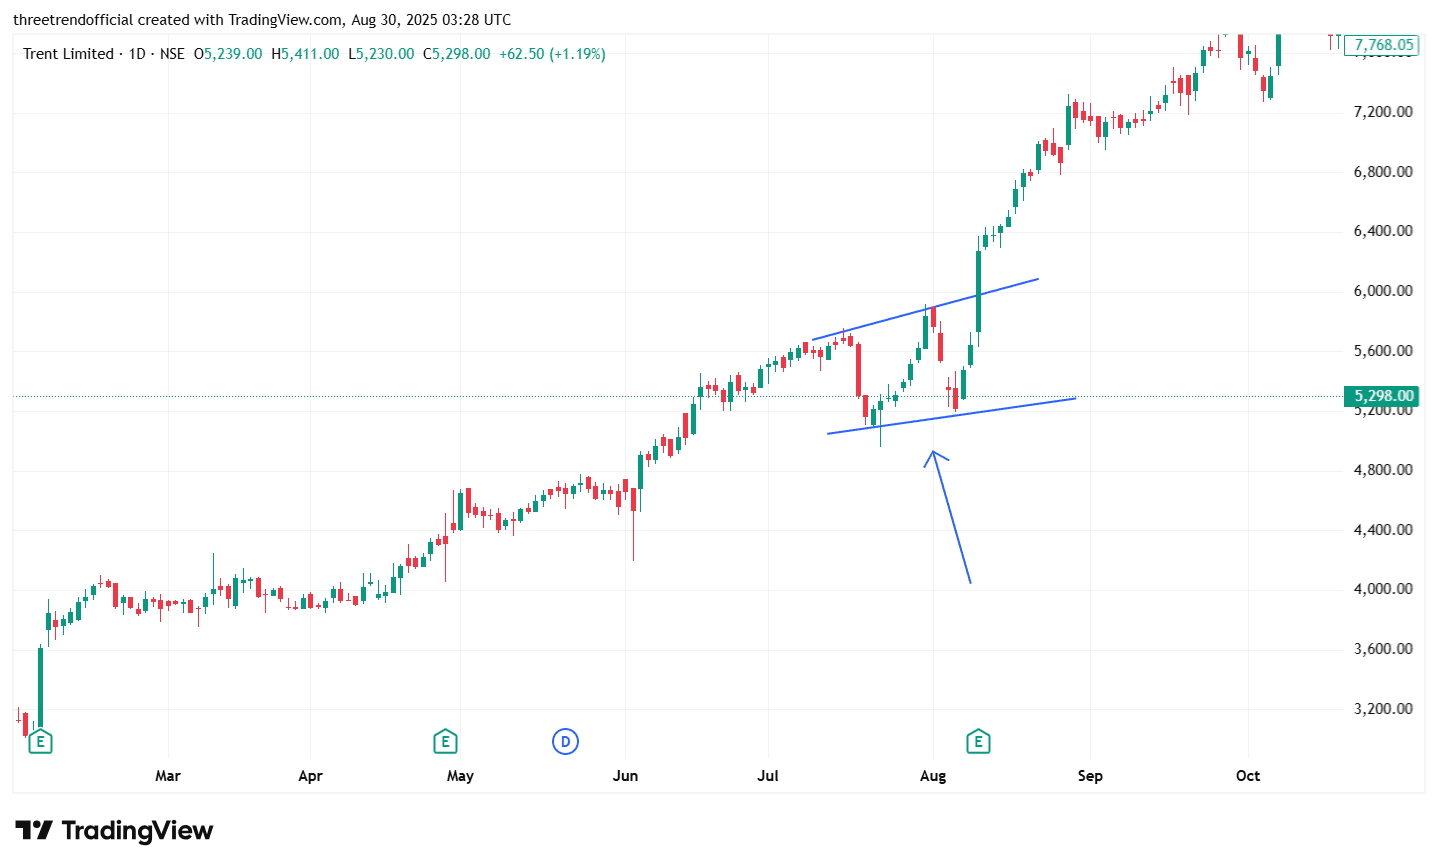
The chart of Trent Limited shows a rising wedge pattern, where prices moved upward within two converging trendlines. A rising wedge generally signals a potential loss of momentum, as although prices continue to rise, the slope of both support and resistance lines narrows, reflecting weakening buying strength. In this case, after testing the support trendline (blue arrow), the stock rebounded strongly and eventually broke out on the upside, continuing its bullish rally. The use of this pattern is significant because traders watch it closely for either a breakdown (which would suggest a bearish reversal) or a breakout (indicating trend continuation). Here, the bullish breakout confirmed strength, offering traders a potential entry point for further upside.