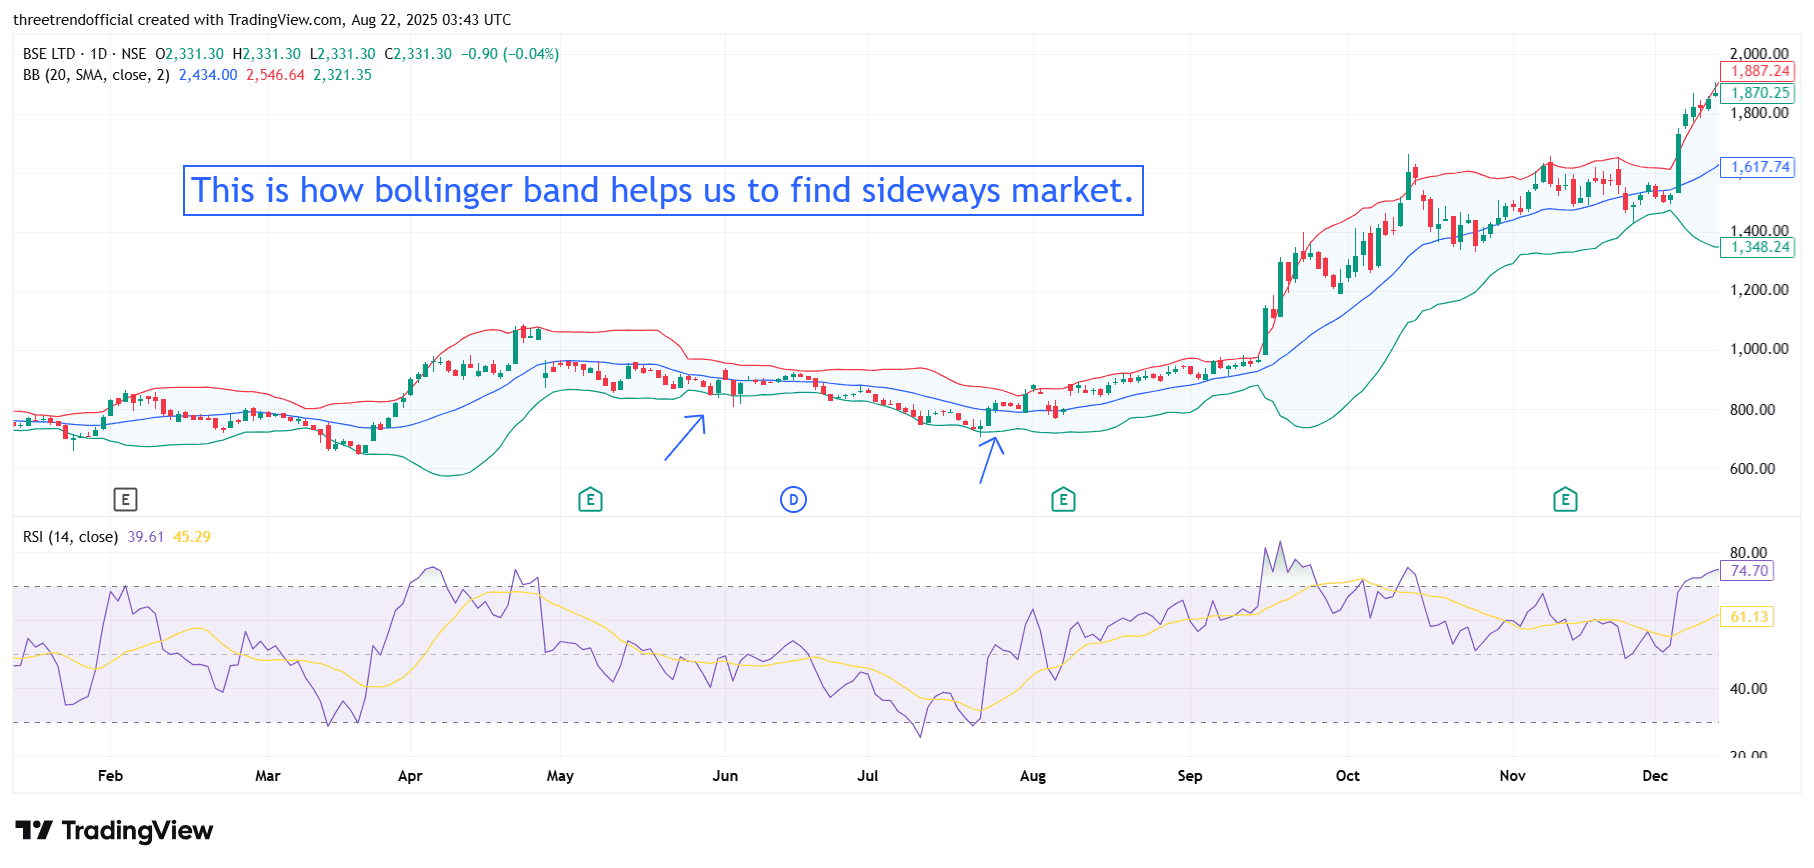
The chart shared is a good example of how Bollinger Bands help in identifying a sideways (range-bound) market:
Narrow Bands (Low Volatility) –
When the Bollinger Bands contract and stay relatively flat, it indicates the market is moving sideways with low volatility.
🔹 In chart, the arrows highlight such phases where price is consolidating within a tight range.
Price Staying Between Bands –
During sideways markets, prices often oscillate between the upper and lower bands without breaking out strongly in either direction.
🔹 That’s what’s happening in the middle section of your chart.
Breakout Signals –
When the bands expand after contraction, it usually signals the start of a trending move (either up or down).
🔹 You can see that clearly after August in the chart where prices break out and an uptrend begins.
so, the key takeaway:
Sideways Market = Bollinger Bands narrow & horizontal, prices bouncing within the bands.
Trending Market = Bands expand, price breaks out from consolidation.