


Vedanta
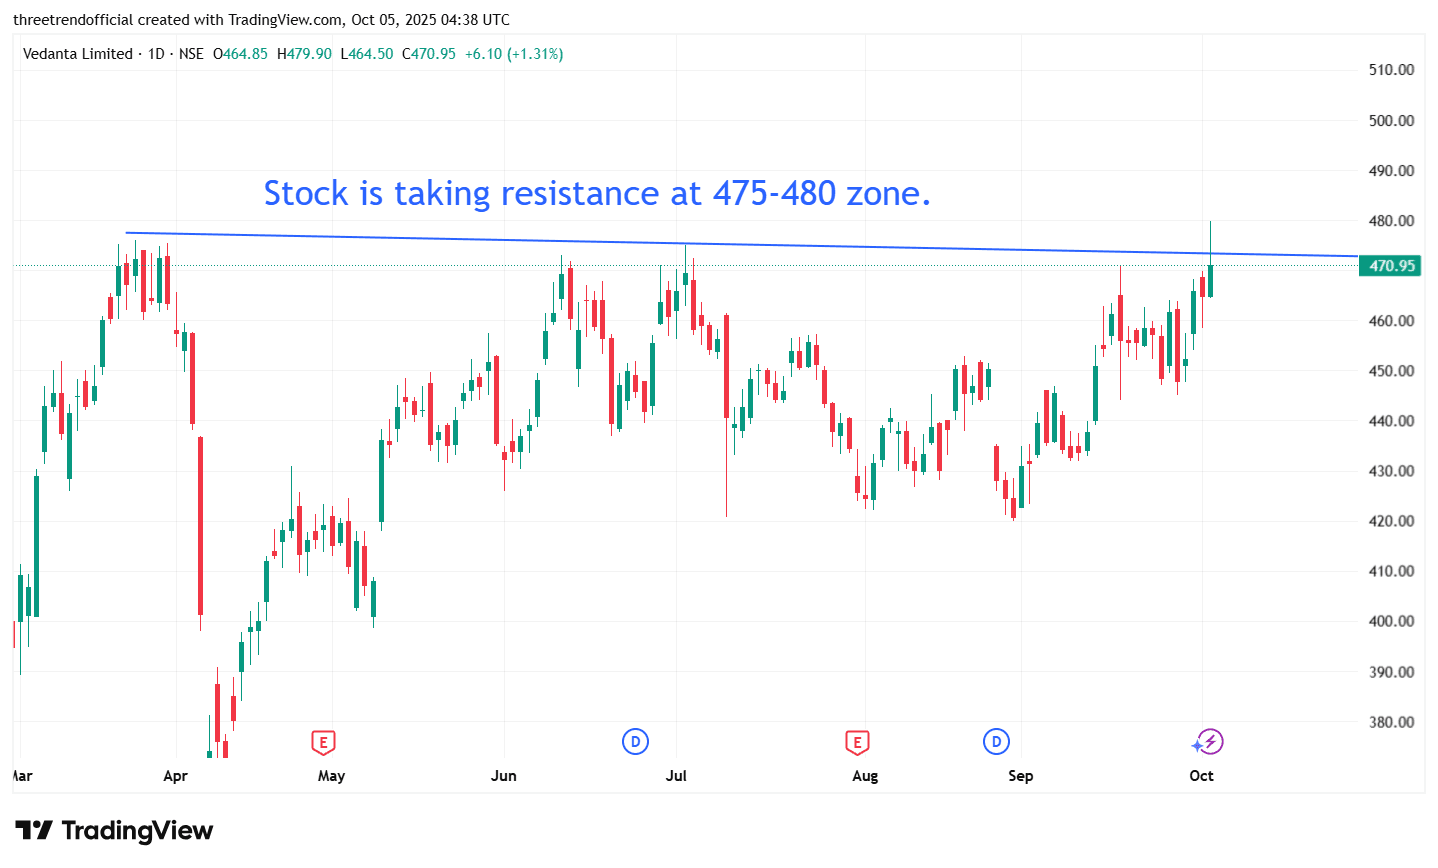
VEDL Stock is taking resistance near 475-480 zone.
A resistance trend line is drawn by connecting two or more swing highs (peaks) on a price chart where the market has previously faced selling pressure and failed to move higher. To draw it, identify at least two significant highs where price reversed downward, then use a straight line to connect them — the more times the price touches this line without breaking it, the stronger the resistance. The line should slope downward in a downtrend or be horizontal in a sideways market, showing where sellers consistently enter and push prices lower.
#TechnicalViews#FundamentalViews
509 likes·63 comments