


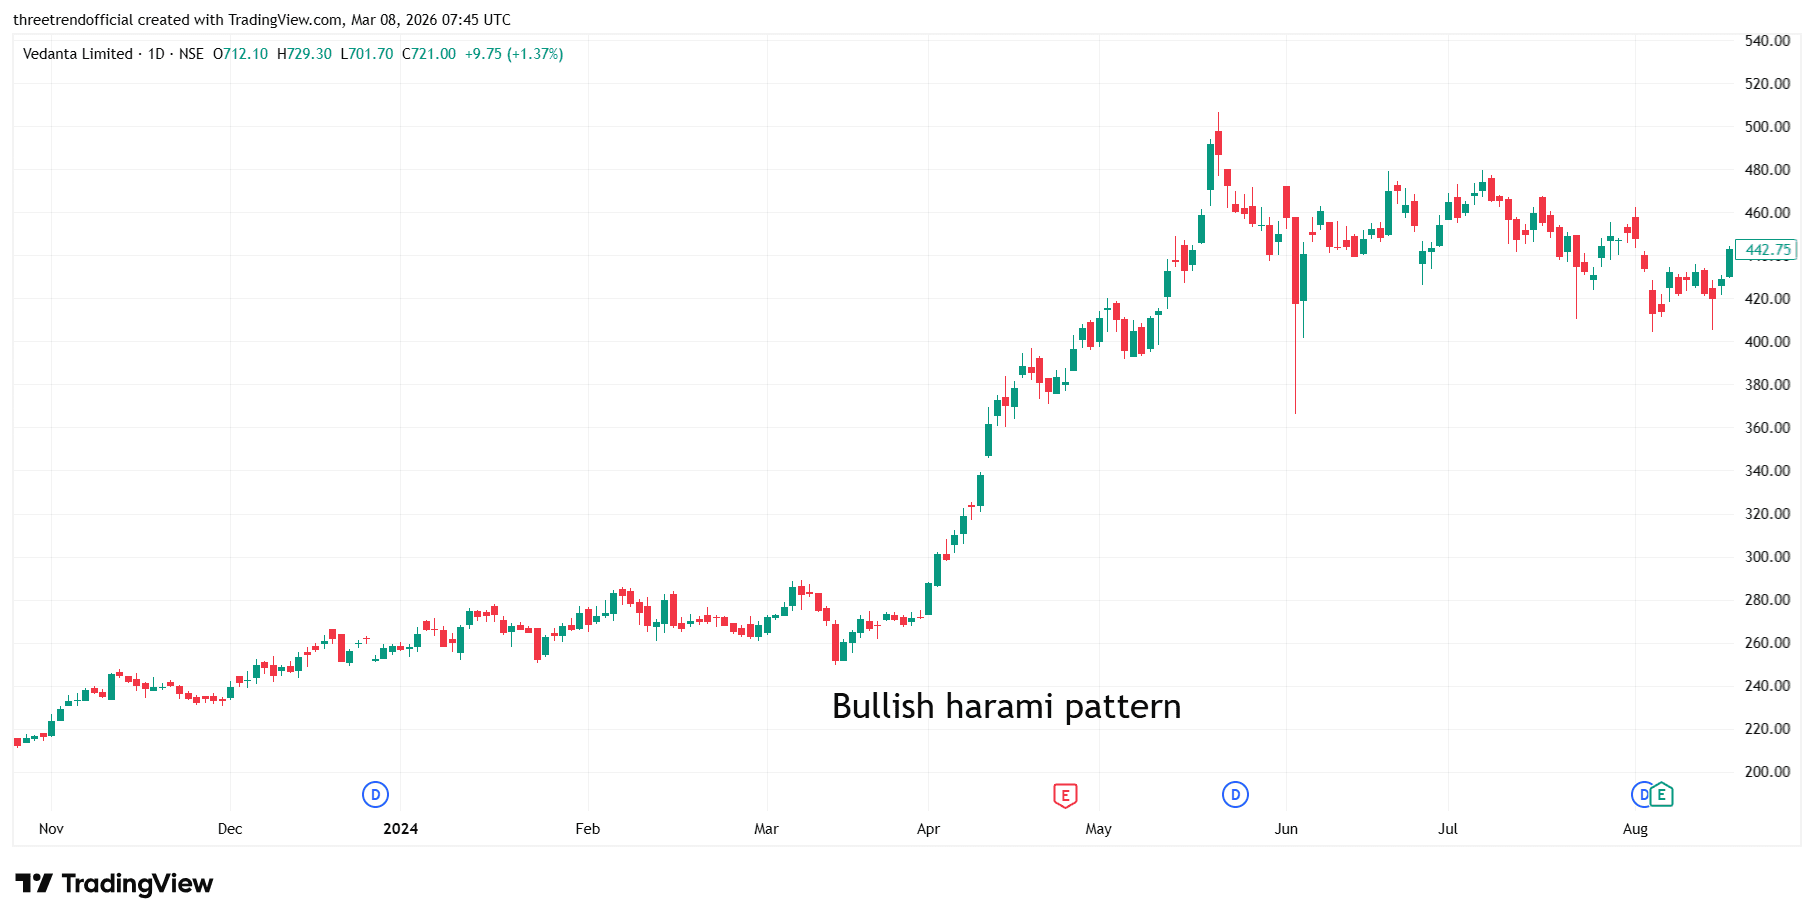
VEDL A Bullish Harami is a two-candlestick reversal pattern that usually appears after a downtrend and signals that selling pressure may be weakening. For example, suppose a stock is falling from ₹500 to ₹460 and forms a large bearish red candle. On the next day, the stock opens near ₹458 and closes at ₹465, creating a small bullish candle that stays completely within the body of the previous red candle. This indicates that sellers are losing control and buyers are starting to enter the market, which may lead to a potential upward reversal if the price moves above the high of the second candle
#TechnicalViews#FundamentalViews
424 likes·75 comments