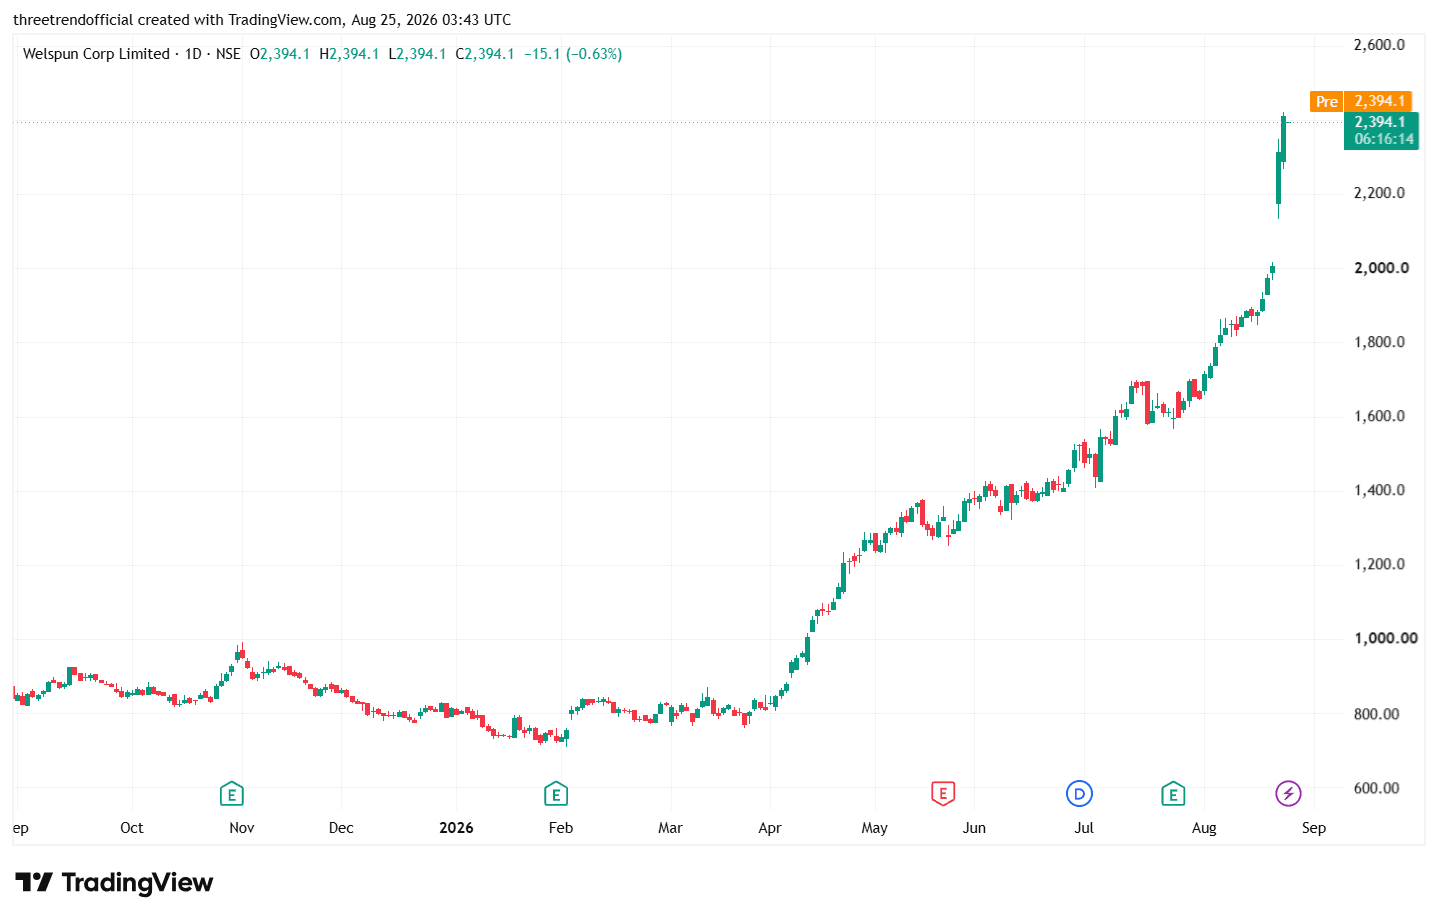
Welspun chart analysis in details attached chart and study
WELENT
Welspun Corp’s daily chart shows a very strong and well-established bullish trend. The price action can be understood in the following way:
1. Long Base Formation
For several months, the stock traded sideways in approximately the ₹750–₹900 range. This was a prolonged base-building/consolidation phase, where selling pressure was gradually absorbed and buyers started accumulating the stock.
2. Transition into an Uptrend
Once the stock moved above the ₹900 area, the structure began changing. Instead of making lower lows, the stock started forming a series of higher highs and higher lows. This is one of the clearest signs of a developing bullish trend.
3. Strong Breakout from the Base
Around April, the stock accelerated sharply from the ₹800–₹850 region and crossed important levels such as ₹1,000, ₹1,200 and ₹1,400. The speed of this move indicates a significant improvement in buying momentum.
4. Higher-Low Structure
During the entire upward move, corrections were relatively limited and the stock repeatedly found support above previous swing lows. This higher-low formation is particularly important because it shows that buyers are willing to enter at progressively higher prices.
5. Rising Trendline Support
The successive swing lows can broadly be connected to form an ascending trendline/support structure. As long as the stock continues to respect this rising structure, the primary trend remains bullish. A decisive breakdown of the important higher-low structure would be the first warning that momentum is weakening.
6. Breakout Above ₹2,000
The ₹2,000 level was an important psychological resistance. Once the stock crossed this level with strong momentum, the price entered a new phase of expansion. The previous resistance around ₹2,000 can now become an important reference/support zone if the stock undergoes a correction.