


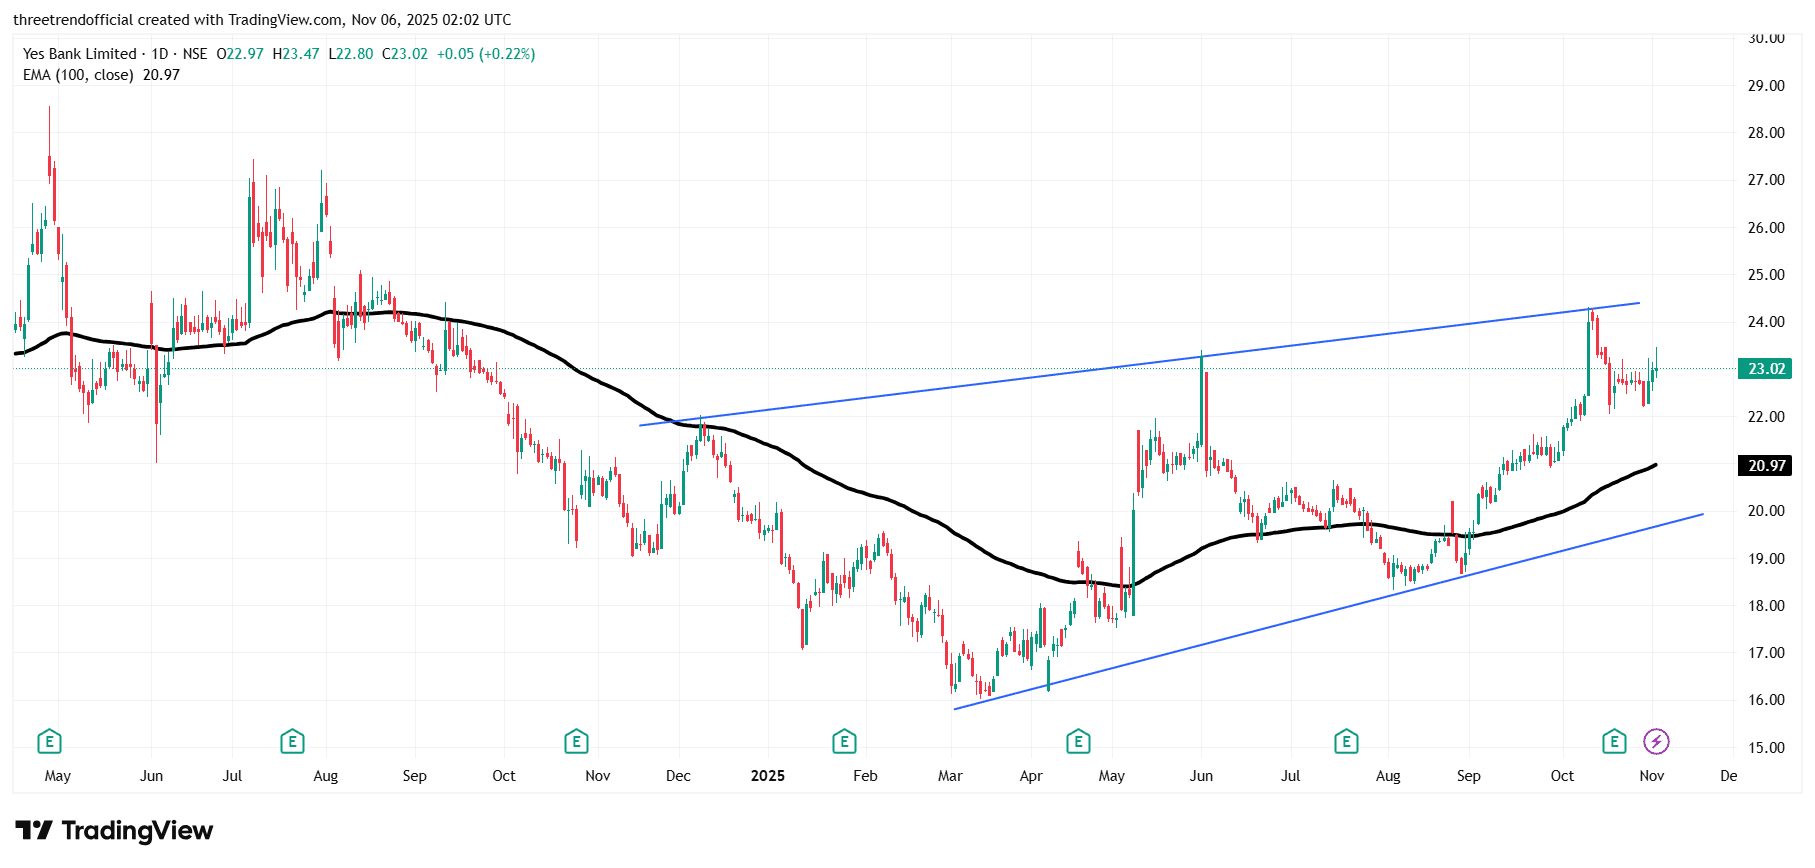
YESBANK When prices move above the 100 EMA (Exponential Moving Average) on the daily chart, it signals that the stock has entered a medium-term bullish phase with improving momentum. The 100 EMA acts as a support level and trend filter, helping traders identify whether the ongoing move has strength and sustainability. When price stays consistently above this line, it suggests that buyers are in control, and short-term pullbacks are likely to find support near the 100 EMA. This often indicates that the stock is transitioning from consolidation to a trending phase, and momentum traders use it as a confirmation of strength within an overall uptrend.
#FundamentalViews#TechnicalViews
424 likes·61 comments