


Grasim Industries – 1D Chart Update
GRASIM
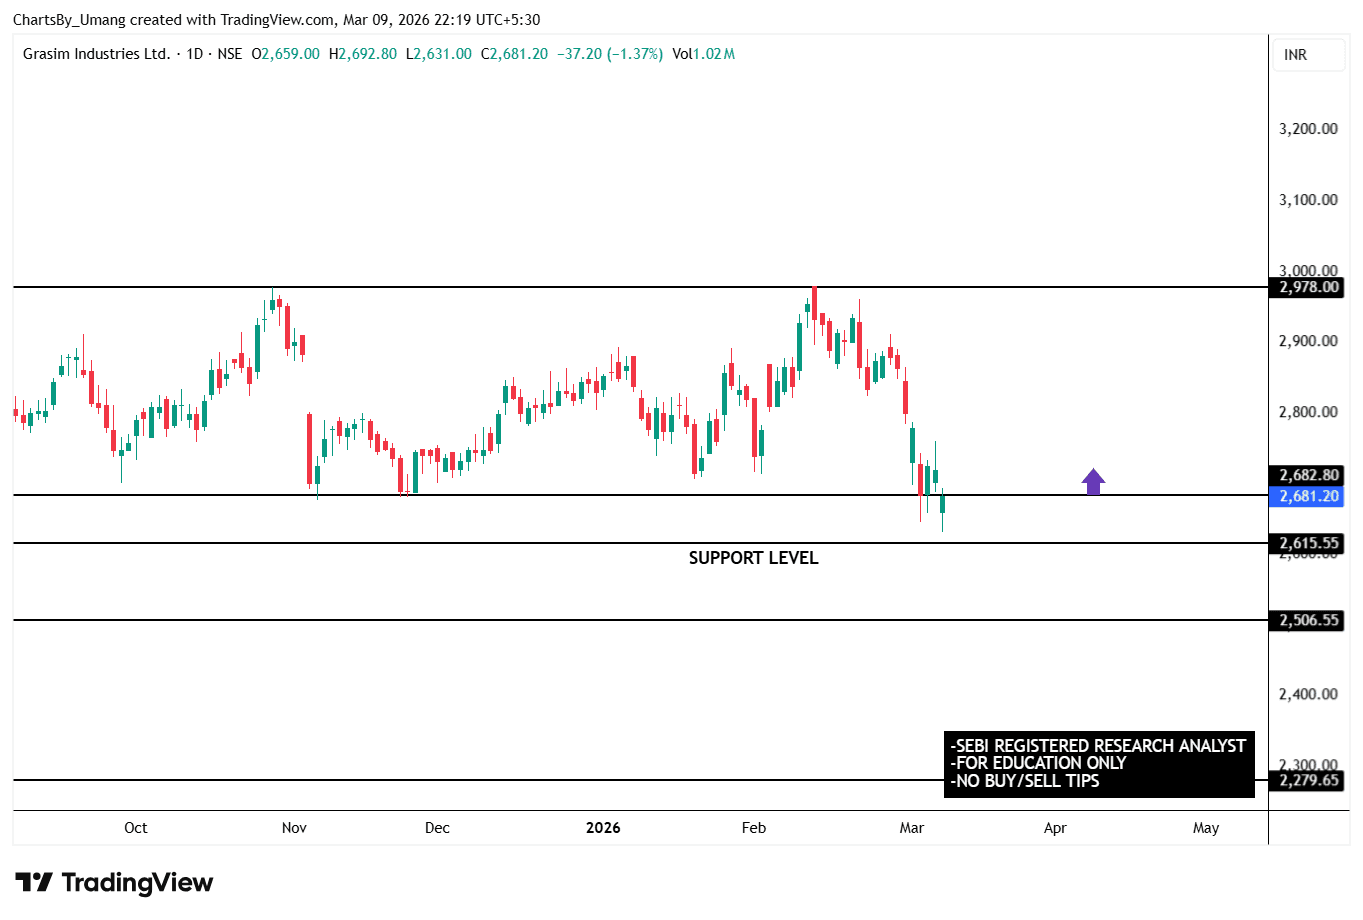
The stock has corrected sharply and is currently testing the 2,615–2,680 support zone, marked as a key demand area on the chart.
Price reaction from this level will be crucial for short-term direction.
Key Levels:
Resistance – 2,978
Immediate Resistance – 2,682
Immediate Support – 2,615
Major Support – 2,506
Holding above 2,615 may lead to a relief bounce toward higher resistance zones.
📲 Join for regular market insights:
*****
Disclaimer:
SEBI Registered Research Analyst. This content is strictly for educational purposes only. No buy/sell recommendation. Please consult your financial advisor before taking any investment decision.
#TechnicalViews
1,178 likes·64 comments