


Indian Oil Corporation (IOC) – 1D Chart Update
IOC
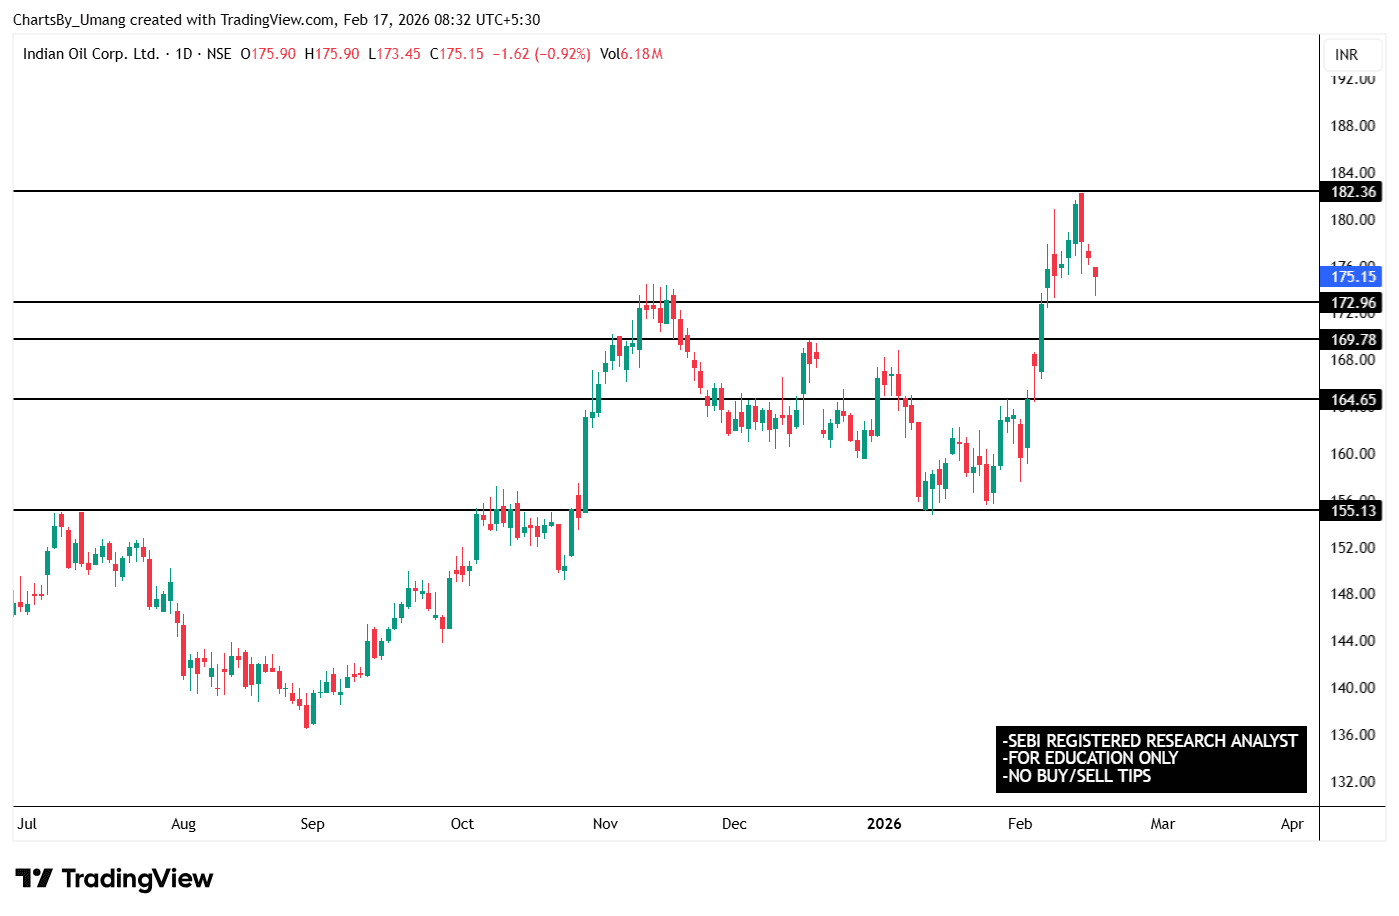
IOC witnessed strong breakout above 169–172 zone and moved toward 182 supply area.
Currently pulling back after sharp rally.
As long as 169–172 holds, structure remains bullish.
Key Levels:
Resistance – 182 / 188
Support – 172 / 169 / 164
Sustained strength above 182 can trigger fresh momentum.
Watch structure carefully.
📲 For daily stock analysis & sector insights:
Join Telegram: *****
Disclaimer:
I am a SEBI Registered Research Analyst. This post is purely for educational purposes. No buy/sell tips are provided. Please consult your financial advisor before investing.
#TechnicalViews
871 likes·52 comments