
‹ All Posts
Unite Technologies Financial

5th Jul 2025 · SEBI-Registered Analyst

Decoding Market Moves: The Real Use of Technical Analysis

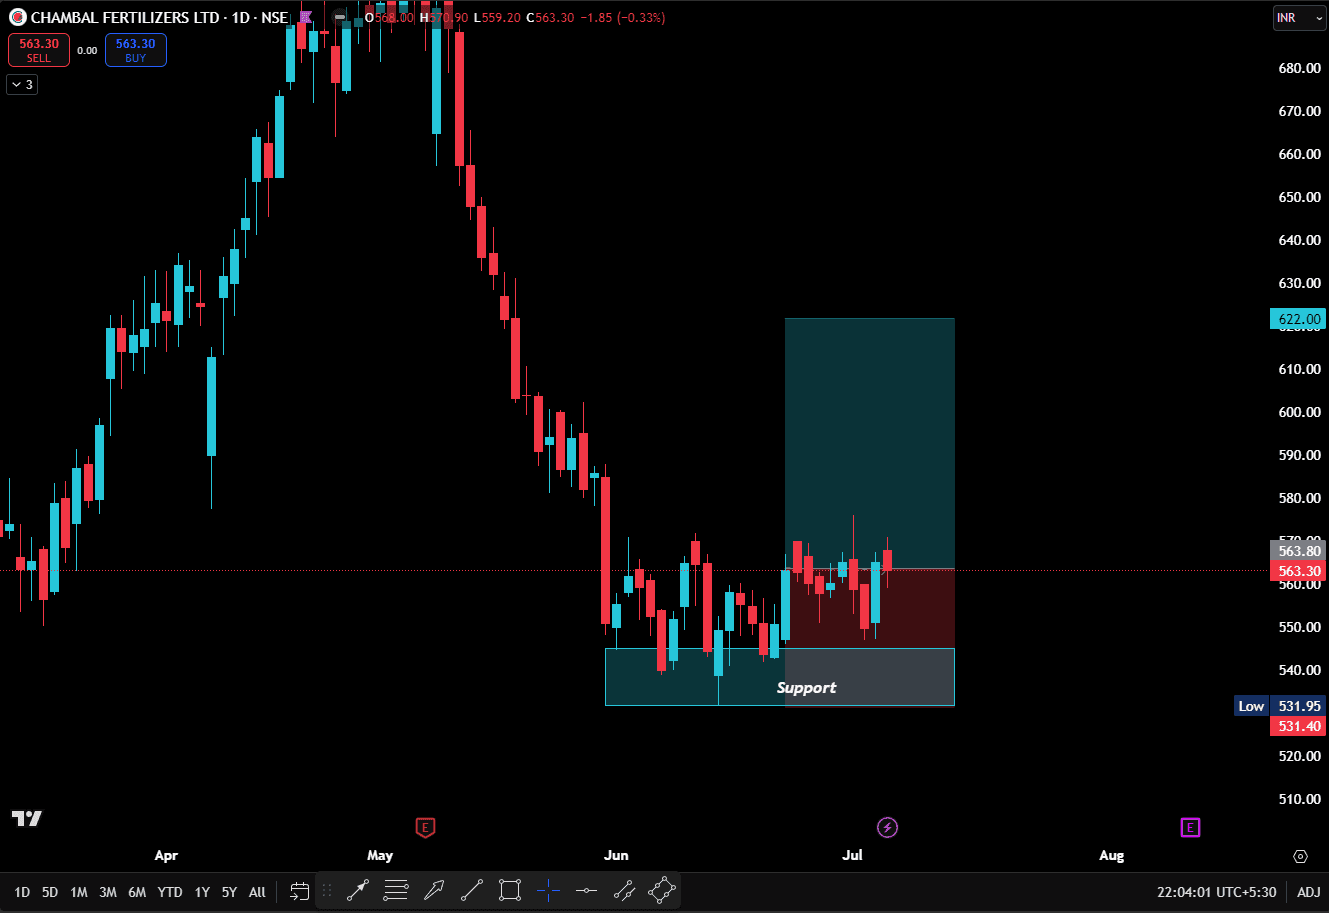
1. Price Action Reading Observing how candles form (wicks, body, gaps) tells us who is in control — buyers or sellers. Example: Bullish engulfing on a support zone = entry signal. 2. Volume Confirmation Price without volume = weak move. Volume tells us strength of conviction behind a move. Breakout with volume = real. Breakout without volume = fakeout. 3. Support and Resistance Zones These are key levels where the price reacts. Support = Demand Zone Resistance = Supply Zone Used to place stop-loss, entries, exits. Example:
RELIANCE
took support at ₹980 three times — strong base, buy near 980. For More Look at the Chart of
CHAMBLFERT
Below 4. Indicators and Oscillators Its Purely Depends on the Niche of Trader Contraction Setup Trader :- Bollinger Band Buy the Dips Trader :- Fibonacci Level ( Golden Ratio) Dynamic S & R Trader :- Moving Average 5. Timeframes Matter "Analysis on multiple timeframes gives more accuracy" 5Min/15Min-> Intraday 1H/4H-> Swing 1D/1W ->Positional/Investing 🎯 Entry on lower TF, confirmation from higher TF = Powerful setup. Conclusion:- "Technical Analysis doesn't predict the market — it prepares you for what the market might do next." It’s like using a GPS before starting your trade journey — It may not avoid all the bumps, but it keeps you on track.

#TechnicalViews#WatchOutFor
chambal fert.png
681 likes·67 comments