



InterGlobe Aviation Ltd – INDIGO (Hourly Chart )
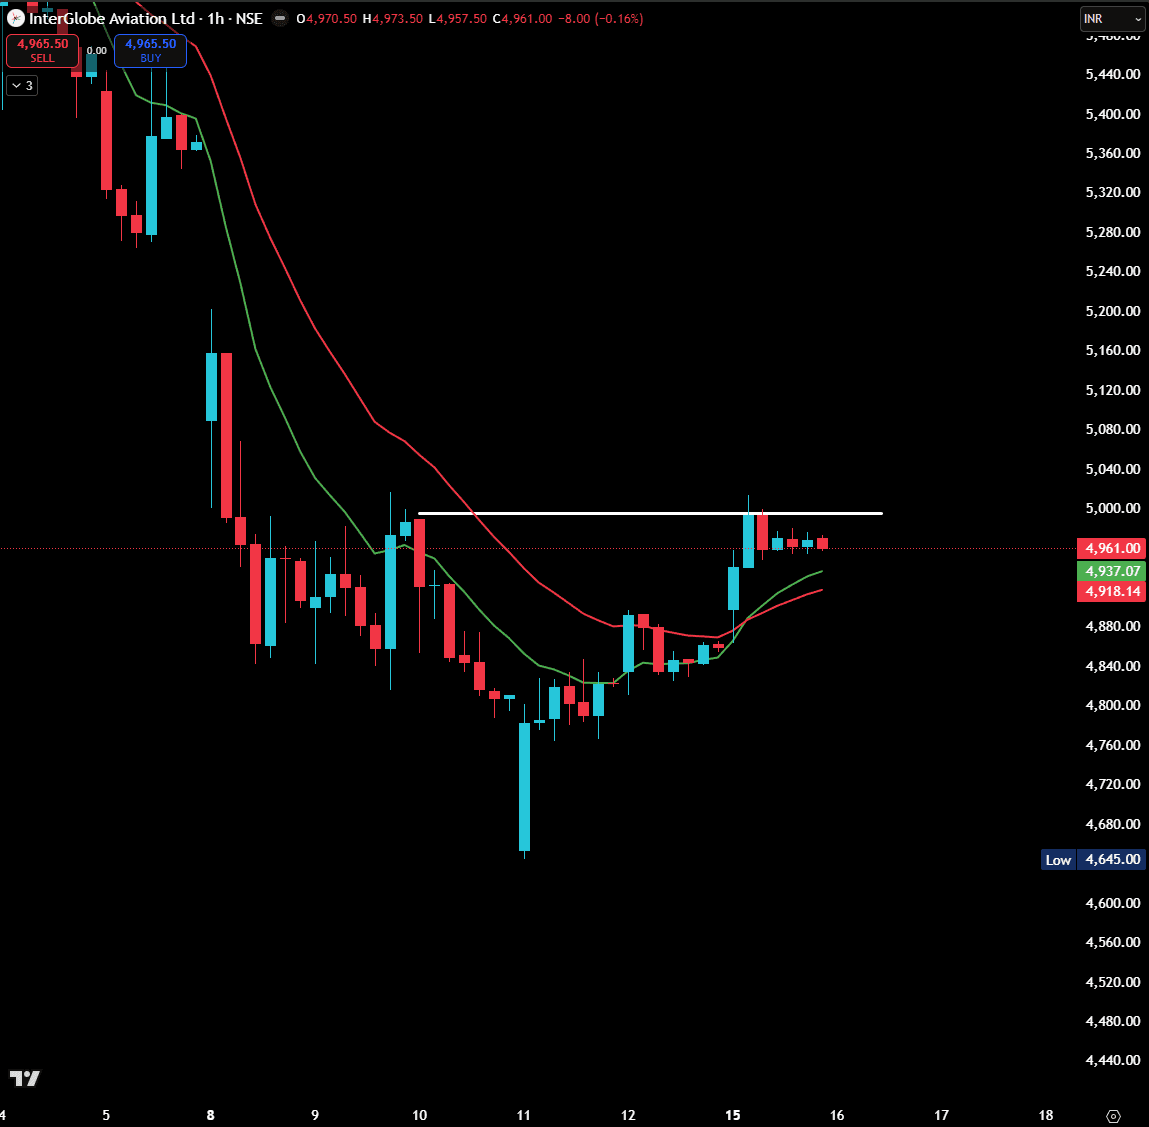
After a corrective decline, in INDIGO is moving into a sideways consolidation phase, indicating potential base formation.
Key Support & Resistance:
Support: 4930 – 4880
Major Support: 4750 – 4650
Resistance: 5000 – 5050
Indicators:
Price is trading near the 20 EMA, facing resistance near the 50 EMA
Momentum remains neutral
Volume expansion is required for directional clarity
Price Action Insight:
Repeated small-range candles near resistance reflect indecision. A decisive move above 5000 or rejection from this zone will define the next trend.
Technical Outlook:
Neutral. Range-bound behavior likely until a clear breakout or breakdown occurs.
#WatchOutFor#TechnicalViews#TrendingSectors
1,165 likes·72 comments