



Siemens Limited Daily Chart Shows Sustained Uptrend, Eyes on Recent Highs
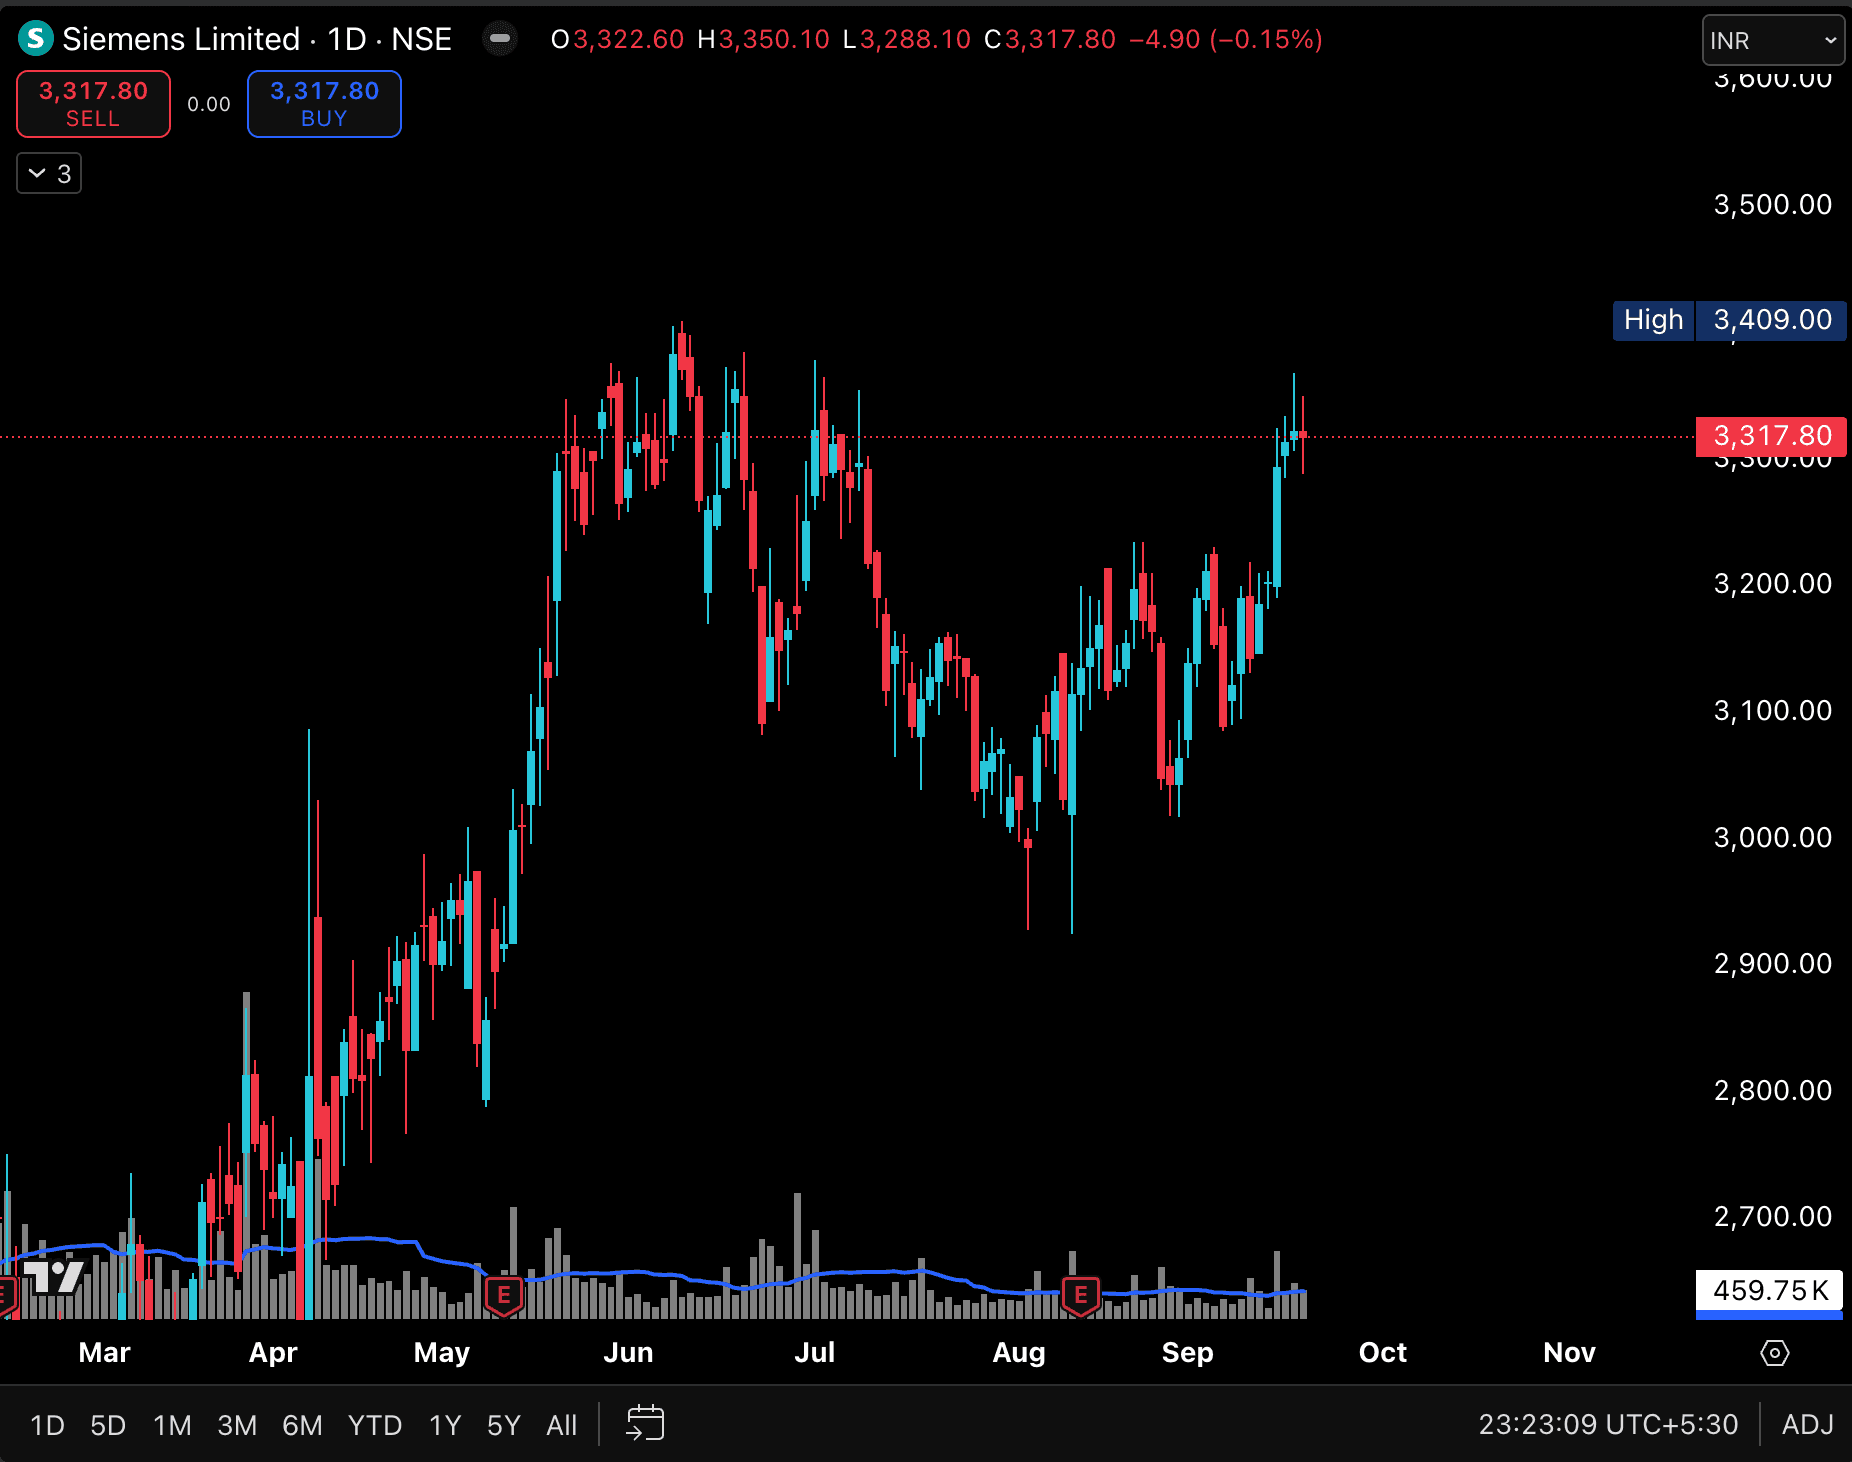
SIEMENS daily chart reveals a well-structured uptrend, with recent candles marking a series of higher lows and higher highs. The breakout above consolidation zones signals renewed buyer interest.
Volume patterns, especially above the median blue line, indicate steady accumulation by participants.
The price closing above both immediate swing highs and moving averages solidifies bullish momentum.
The critical resistance is near 3,409, the previous peak a breakout above this level could signal further upside.
If price consolidates above 3,300, it may serve as a base for subsequent moves.
Risk management remains key; any retracement below 3,200 should be watched for possible trend exhaustion.
#WatchOutFor#TechnicalViews#StockInNews#HiddenGems
1,160 likes·76 comments