



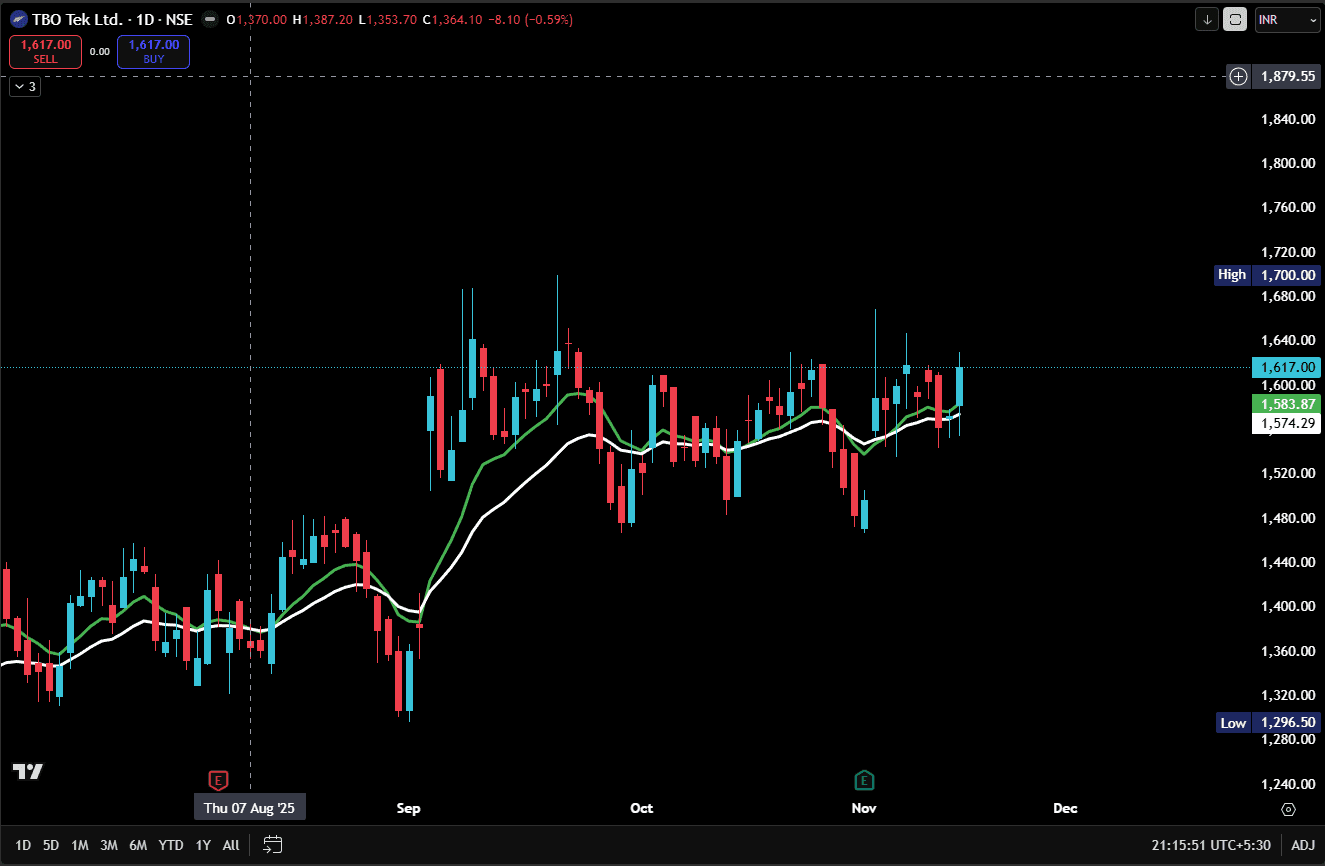
TBO TEK – Technical Analysis (1D Chart)
TBOTEK chart looks more range-bound compared to Sobha. Price has been stuck between the 1520–1640 zone for a long time, indicating clear consolidation. The moving averages are flat, which confirms a neutral structure.
Recently, price made a bullish attempt by closing above the averages, but long upper wicks show sellers are still active at higher levels. The overall trend is neutral-to-slightly bullish but needs a breakout for confirmation.
Key Levels:
Immediate Support: 1,575 – 1,585
Strong Support: 1,520
Resistance: 1,640
Major Breakout Level: 1,700 — a close above this level may open strong upside momentum.
Until a clean breakout happens, the stock may continue moving sideways inside the range.
#WatchOutFor#Today’sTradingSetup#TechnicalViews
446 likes·19 comments