



BANK NIFTY CHART ANALYSIS - POST CLOSING COMMENTARY
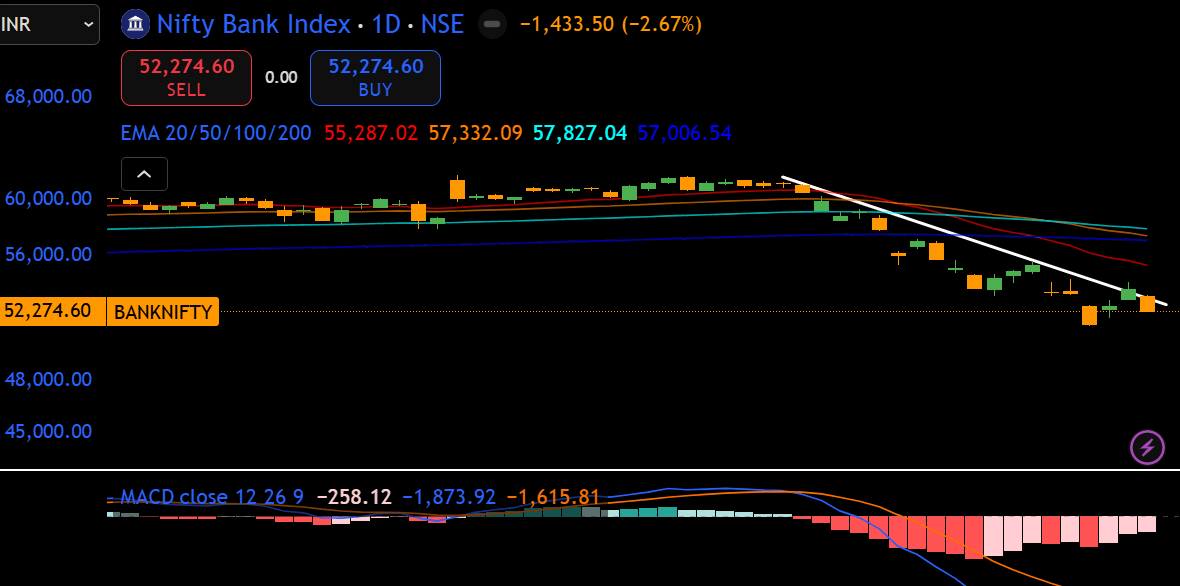
As of March 28, 2026, Bank Nifty is exhibiting a bearish technical structure following a sharp sell-off in the final trading session of the week. The index closed at 52,274.60, dropping 1,433.50 points (-2.67%) on March 27, 2026, as intense selling pressure gripped both private and PSU banking stocks.
Bank Nifty is trading below the trend line resistance on daily chart and is trading below all the major 20-day, 50-day, 100-day and 200-day EMA (Exponential moving average). Macd below zero and Relative Strength Index has slipped toward 30, approaching the oversold zone, which signals a significant loss of near-term strength.
Technically we may expect more downside in the coming week.
Top Losers : CANBK PNB BANKBARODA
#WatchOutFor#IndexStrategies#MacroViews#TechnicalViews#Post-ClosingCommentary
940 likes·68 comments