



ICICI Bank Chart Analysis as on 31-Mar-2025
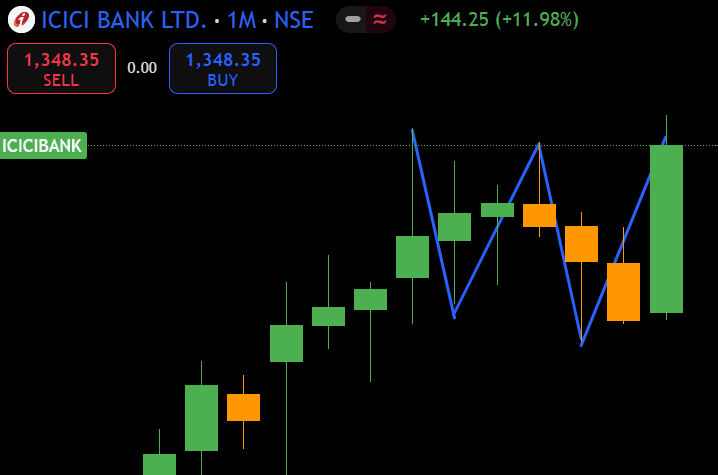
ICICI Bank is one of the Nifty 50 stocks which made a new 52 week high during this month. But it has failed to close above the previous high of 1362.35 on the monthly chart.
"W" Pattern is clearly visible on the monthly chart of ICICI Bank. As per the "w" Pattern we can expect the stock to move higher only if it closes above the new high of 1373 on weekly basis.
If it closes above 1373 on weekly basis we can expect a move up to 1500 to 1525 levels as per the "w" Pattern.
Happy Learning and Happy Trading.
ICICIBANK
#WatchOutFor#TechnicalViews#HiddenGems#PsychologyofMoney#EquityResearch
135 likes·64 comments